Overstock Results Presentation Deck
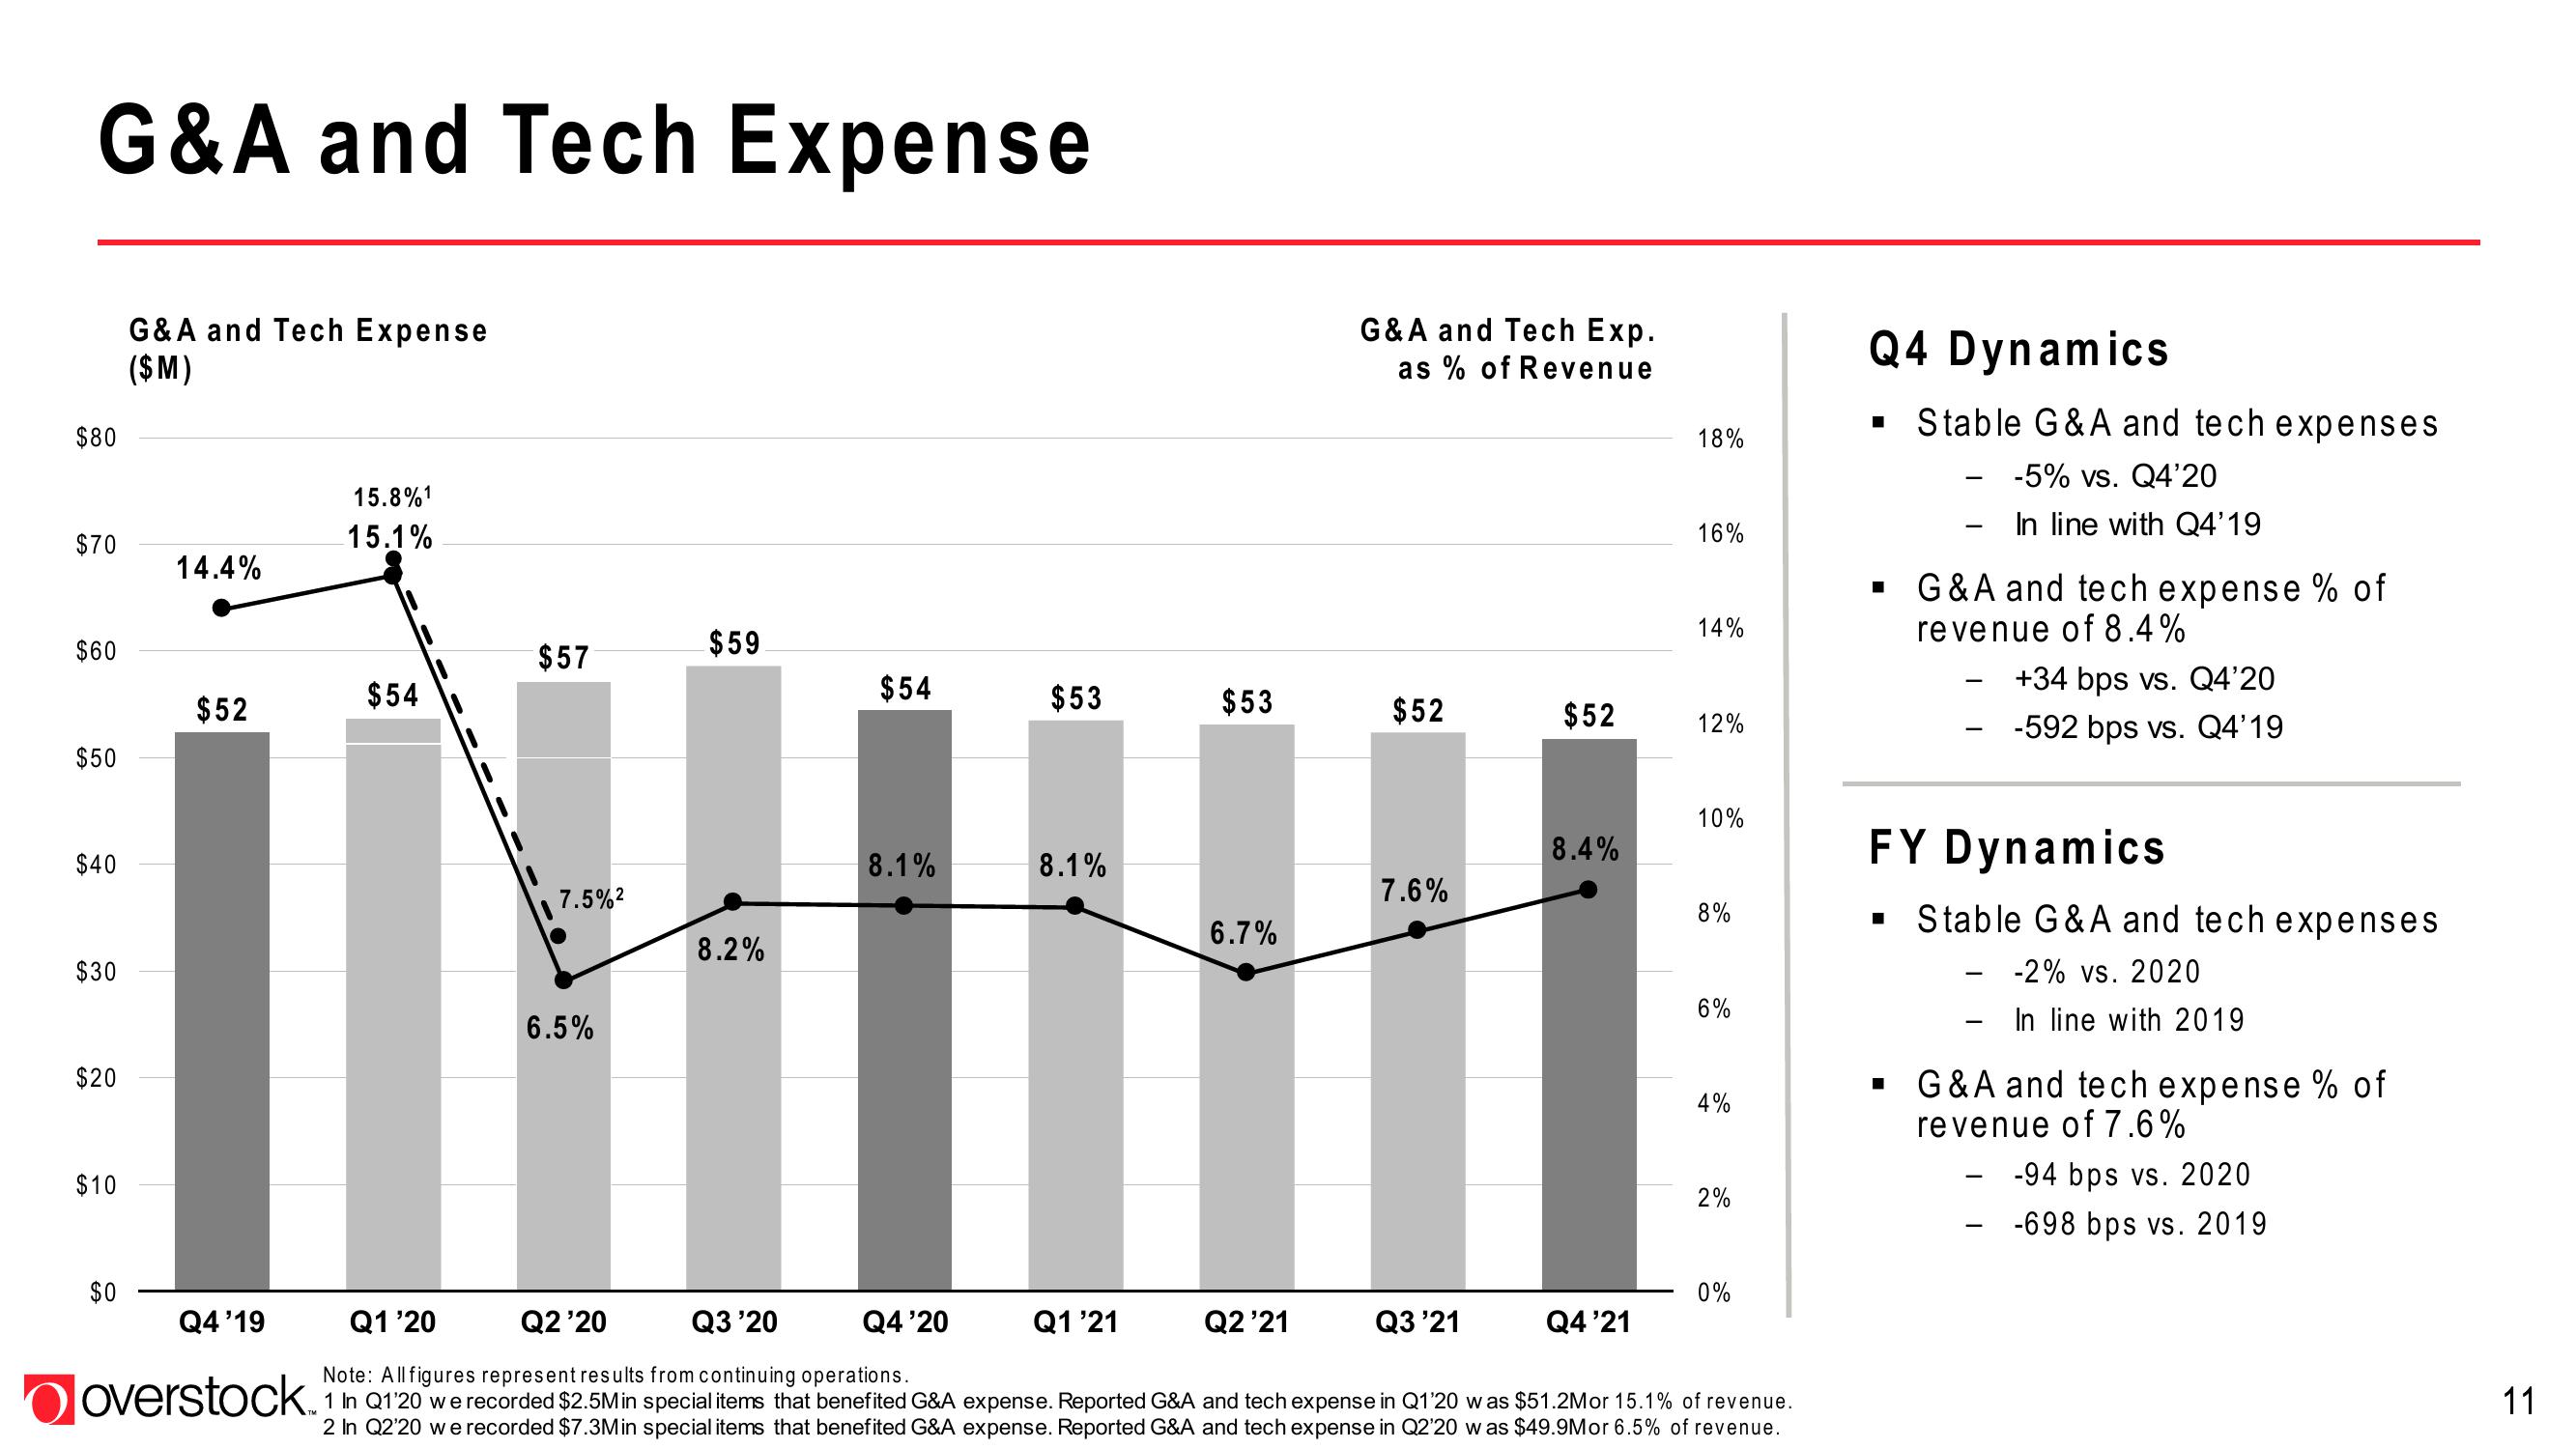
G&A and Tech Expense
$80
$70
$60
$50
$40
$30
$20
$10
$0
G&A and Tech Expense
($M)
14.4%
$52
Q4 '19
overstock.
15.8%1
15.1%
$54
$57
7.5%²
6.5%
$59
8.2%
$54
8.1%
$53
8.1%
Q1'21
$53
6.7%
Q2 '21
G&A and Tech Exp.
as % of Revenue
$52
7.6%
Q3 '21
$52
8.4%
Q4'21
18%
16%
14%
12%
10%
8%
6%
Q1'20
Q2 '20
Q3'20
Q4 '20
Note: Allfigures represent results from continuing operations.
1 In Q1'20 we recorded $2.5Min special items that benefited G&A expense. Reported G&A and tech expense in Q1'20 w as $51.2Mor 15.1% of revenue.
2 In Q2'20 we recorded $7.3Min special items that benefited G&A expense. Reported G&A and tech expense in Q2'20 w as $49.9Mor 6.5% of revenue.
4%
2%
0%
Q4 Dynamics
Stable G&A and tech expenses
-5% vs. Q4'20
In line with Q4'19
■
■
-
■
G&A and tech expense % of
revenue of 8.4%
FY Dynamics
Stable G&A and tech expenses
-2% vs. 2020
In line with 2019
+34 bps vs. Q4'20
-592 bps vs. Q4'19
G&A and tech expense % of
revenue of 7.6%
-94 bps vs. 2020
-698 bps vs. 2019
11View entire presentation