NVIDIA Investor Presentation Deck slide image

NVIDIA Investor Presentation Deck

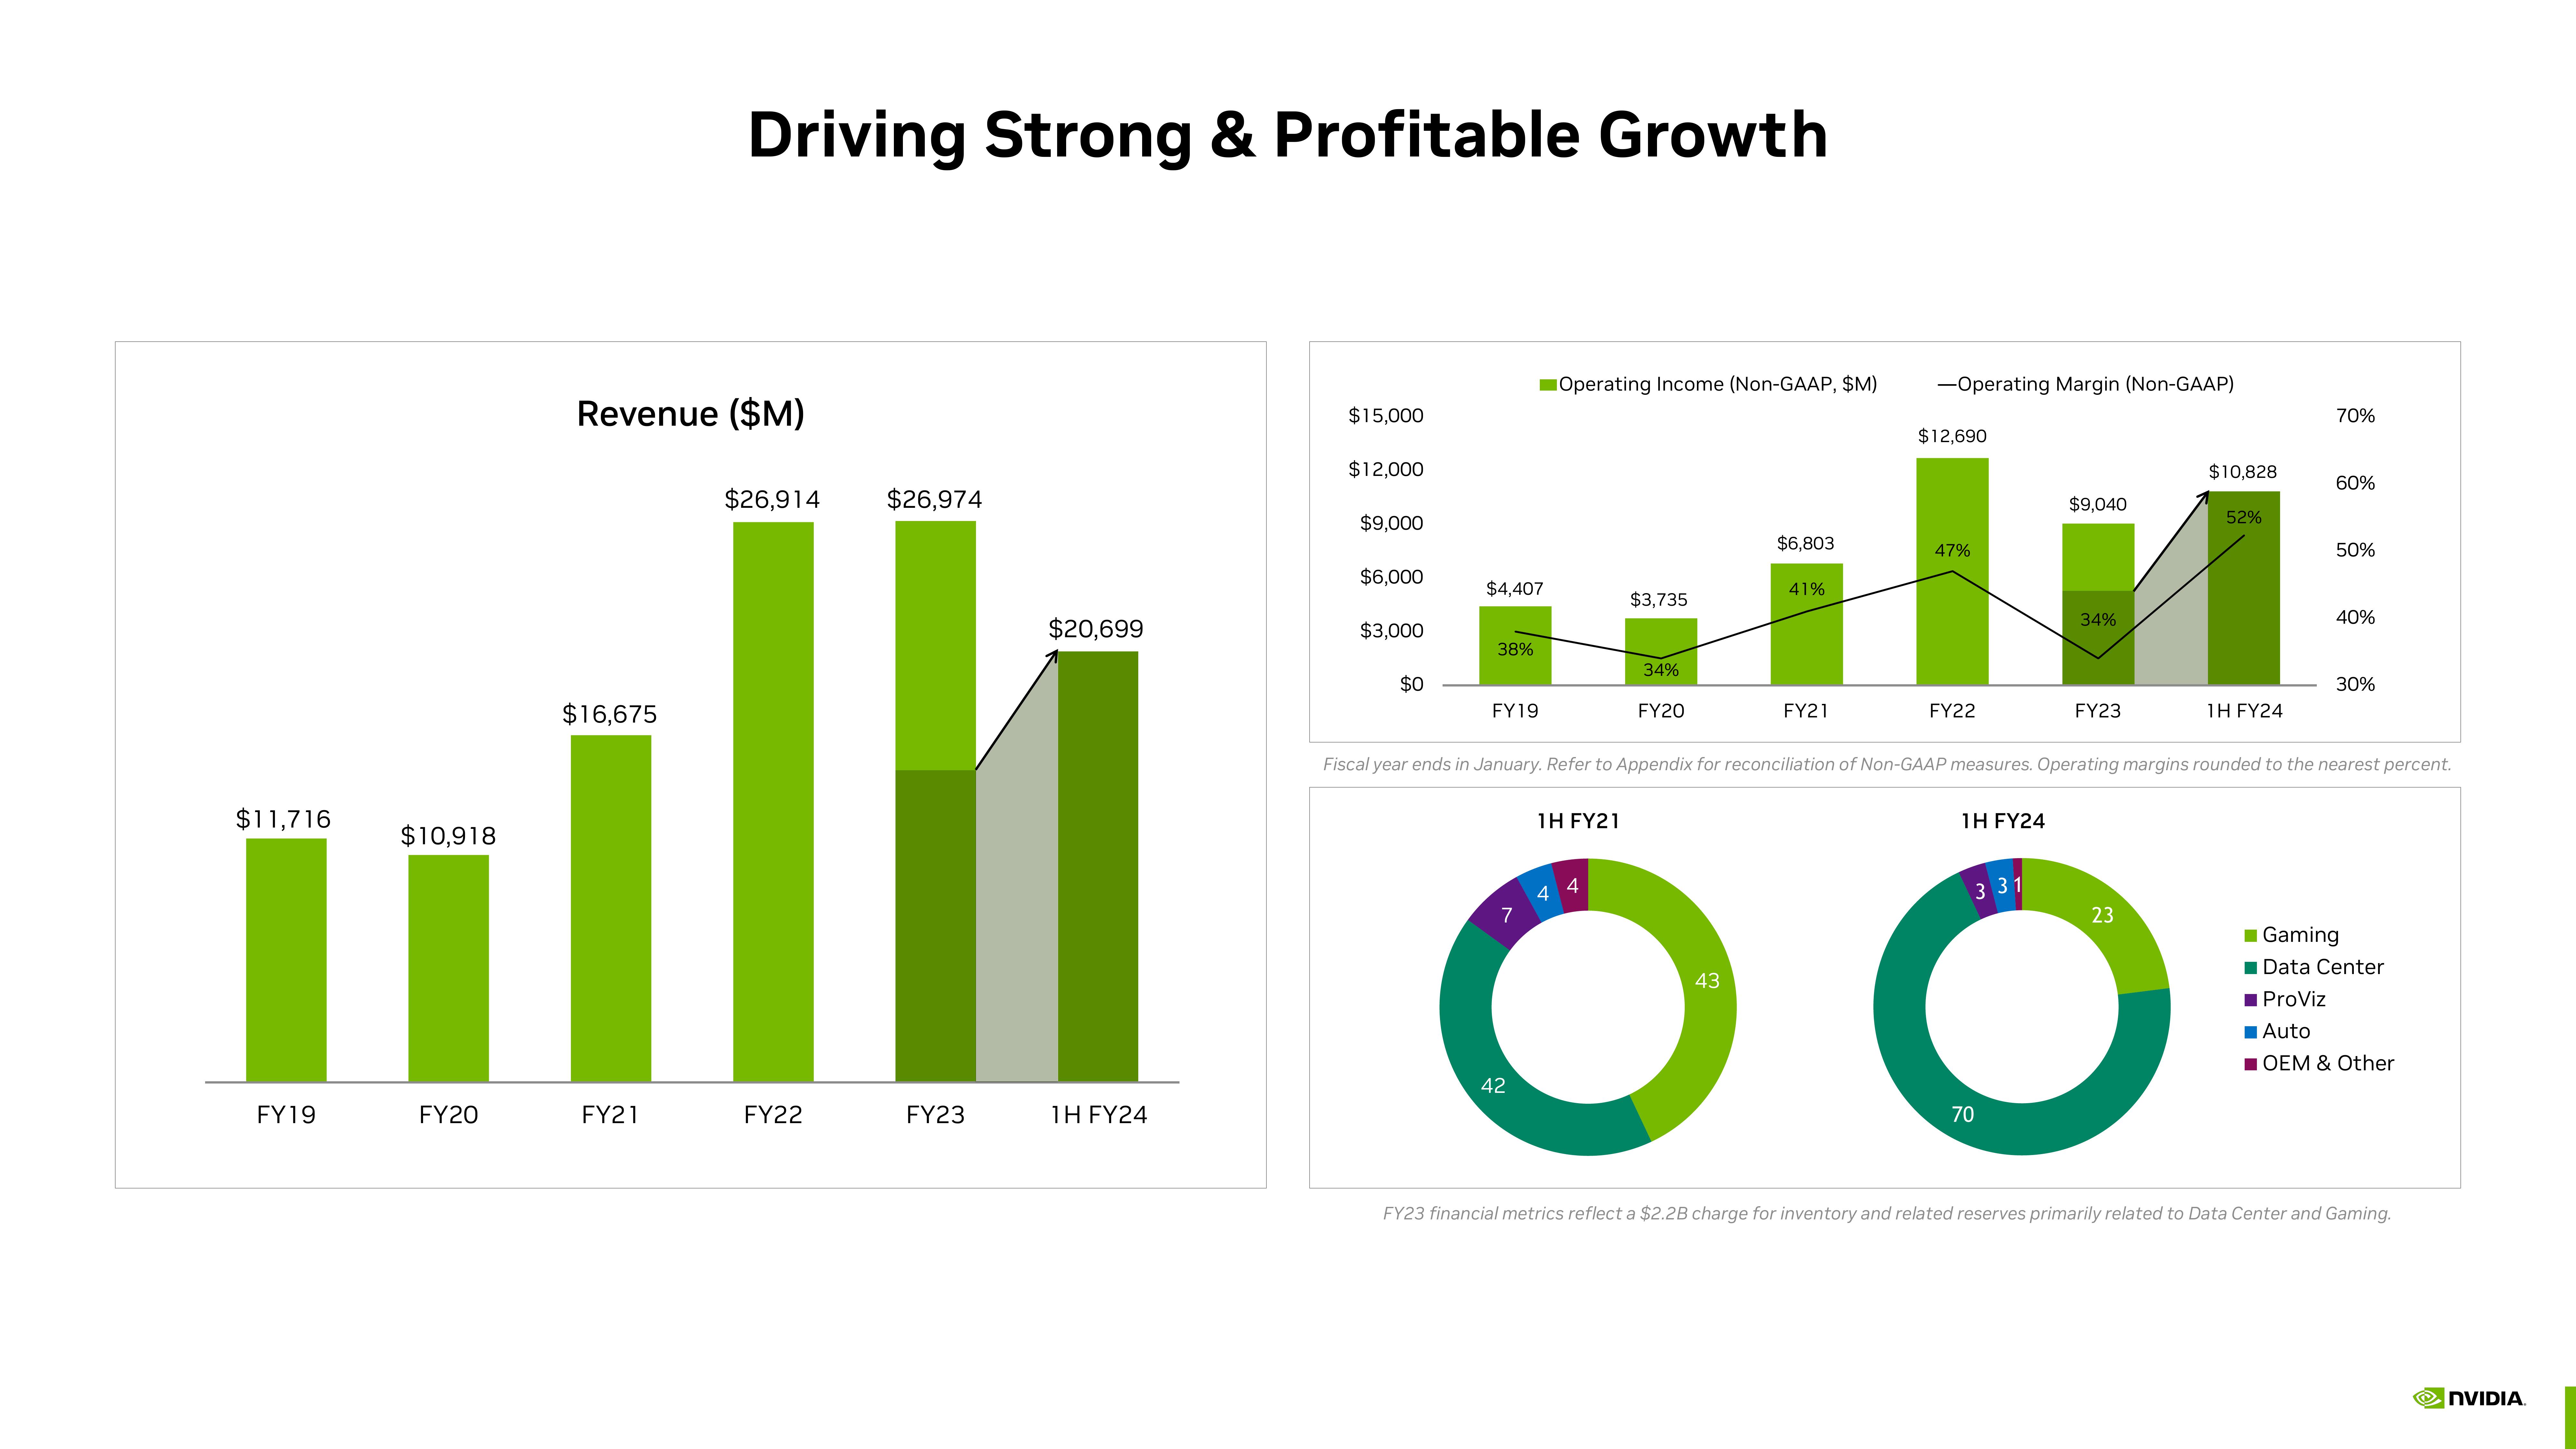
$11,716 FY19 $10,918 FY20 Revenue ($M) $16,675 Driving Strong & Profitable Growth FY21 $26,914 FY22 $26,974 FY23 $20,699 1H FY24 $15,000 $12,000 $9,000 $6,000 $3,000 $0 $4,407 38% FY19 Operating Income (Non-GAAP, $M) 42 1H FY21 $3,735 44 34% FY20 $6,803 43 41% FY21 -Operating Margin (Non-GAAP) $12,690 47% FY22 $9,040 1H FY24 34% FY23 $10,828 331 23 O 70 52% 1H FY24 Fiscal year ends in January. Refer to Appendix for reconciliation of Non-GAAP measures. Operating margins rounded to the nearest percent. 70% 60% 50% 40% 30% Gaming Data Center ProViz ■Auto ■ OEM & Other FY23 financial metrics reflect a $2.2B charge for inventory and related reserves primarily related to Data Center and Gaming. NVIDIA
View entire presentation