Jefferies Financial Group Investor Presentation Deck slide image

Jefferies Financial Group Investor Presentation Deck

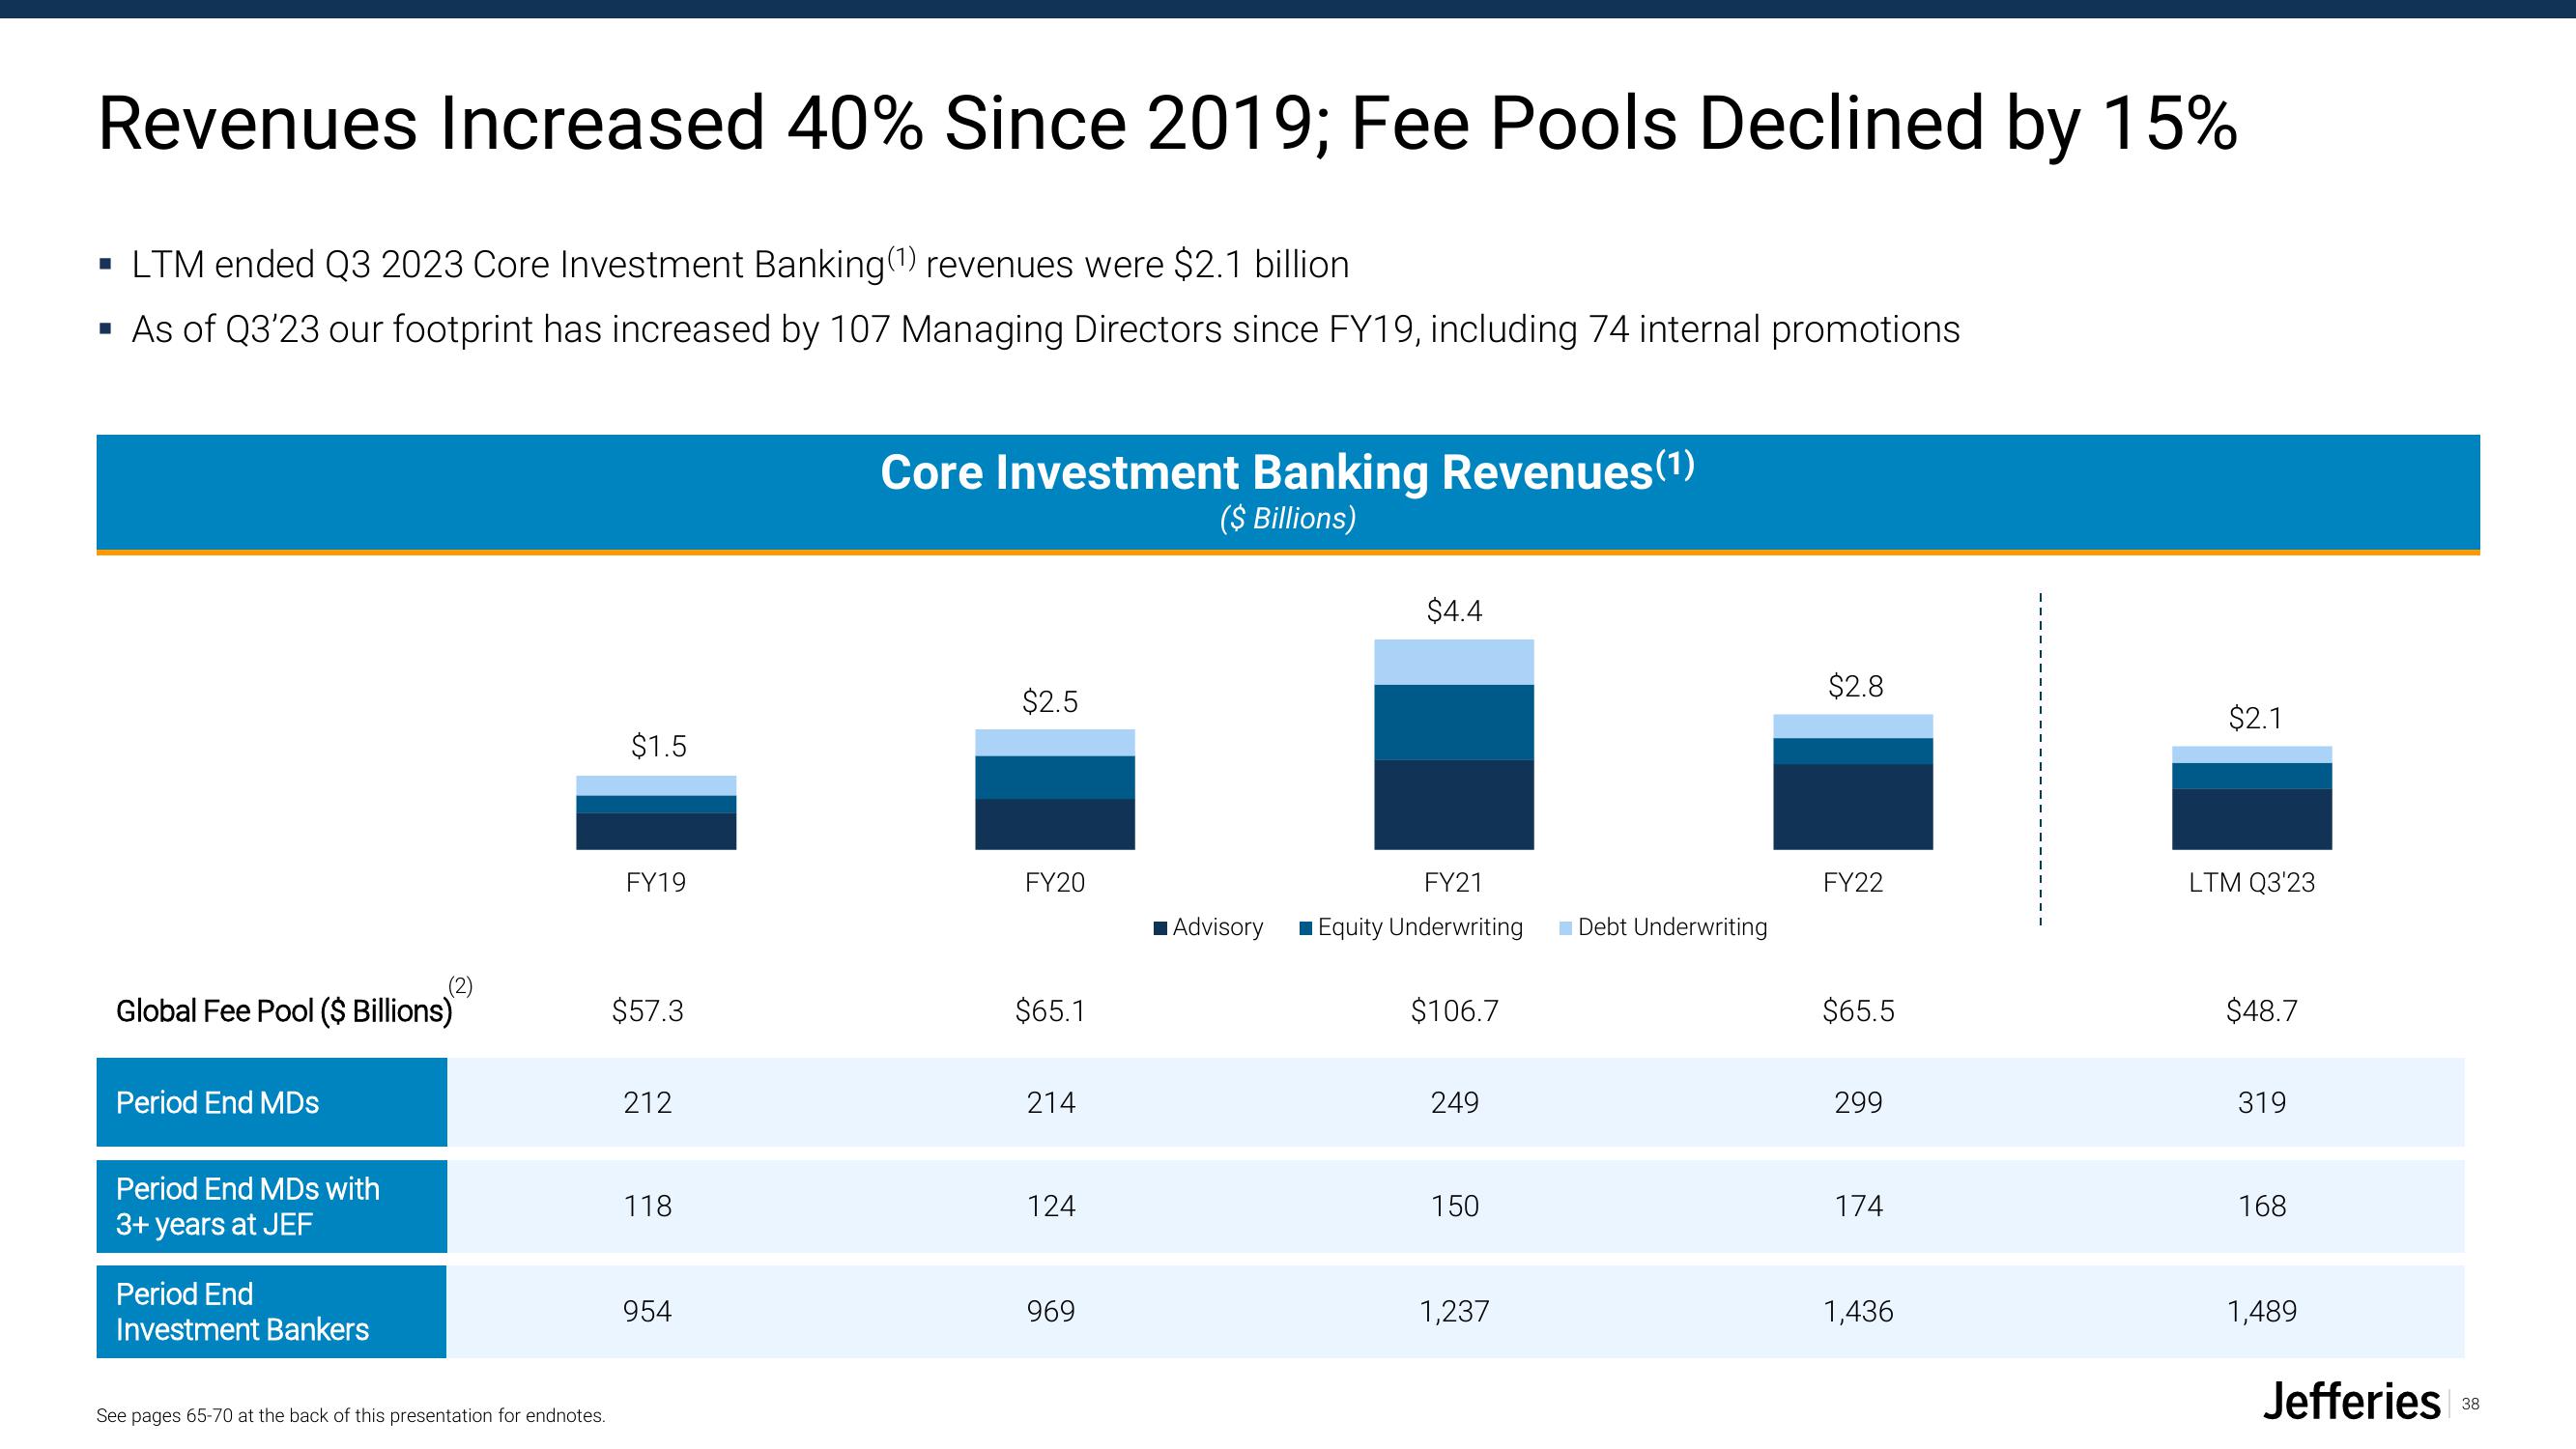
Revenues Increased 40% Since 2019; Fee Pools Declined by 15% ▪ LTM ended Q3 2023 Core Investment Banking (1) revenues were $2.1 billion ▪ As of Q3'23 our footprint has increased by 107 Managing Directors since FY19, including 74 internal promotions Global Fee Pool ($ Billions) Period End MDs Period End MDs with 3+ years at JEF Period End Investment Bankers See pages 65-70 at the back of this presentation for endnotes. $1.5 FY19 $57.3 212 118 954 Core Investment Banking Revenues (1) ($ Billions) $2.5 FY20 $65.1 214 124 969 $4.4 FY21 Advisory ■ Equity Underwriting $106.7 249 150 1,237 Debt Underwriting $2.8 FY22 $65.5 299 174 1,436 $2.1 LTM Q3'23 $48.7 319 168 1,489 Jefferies 38
View entire presentation