Sterling Results Presentation Deck
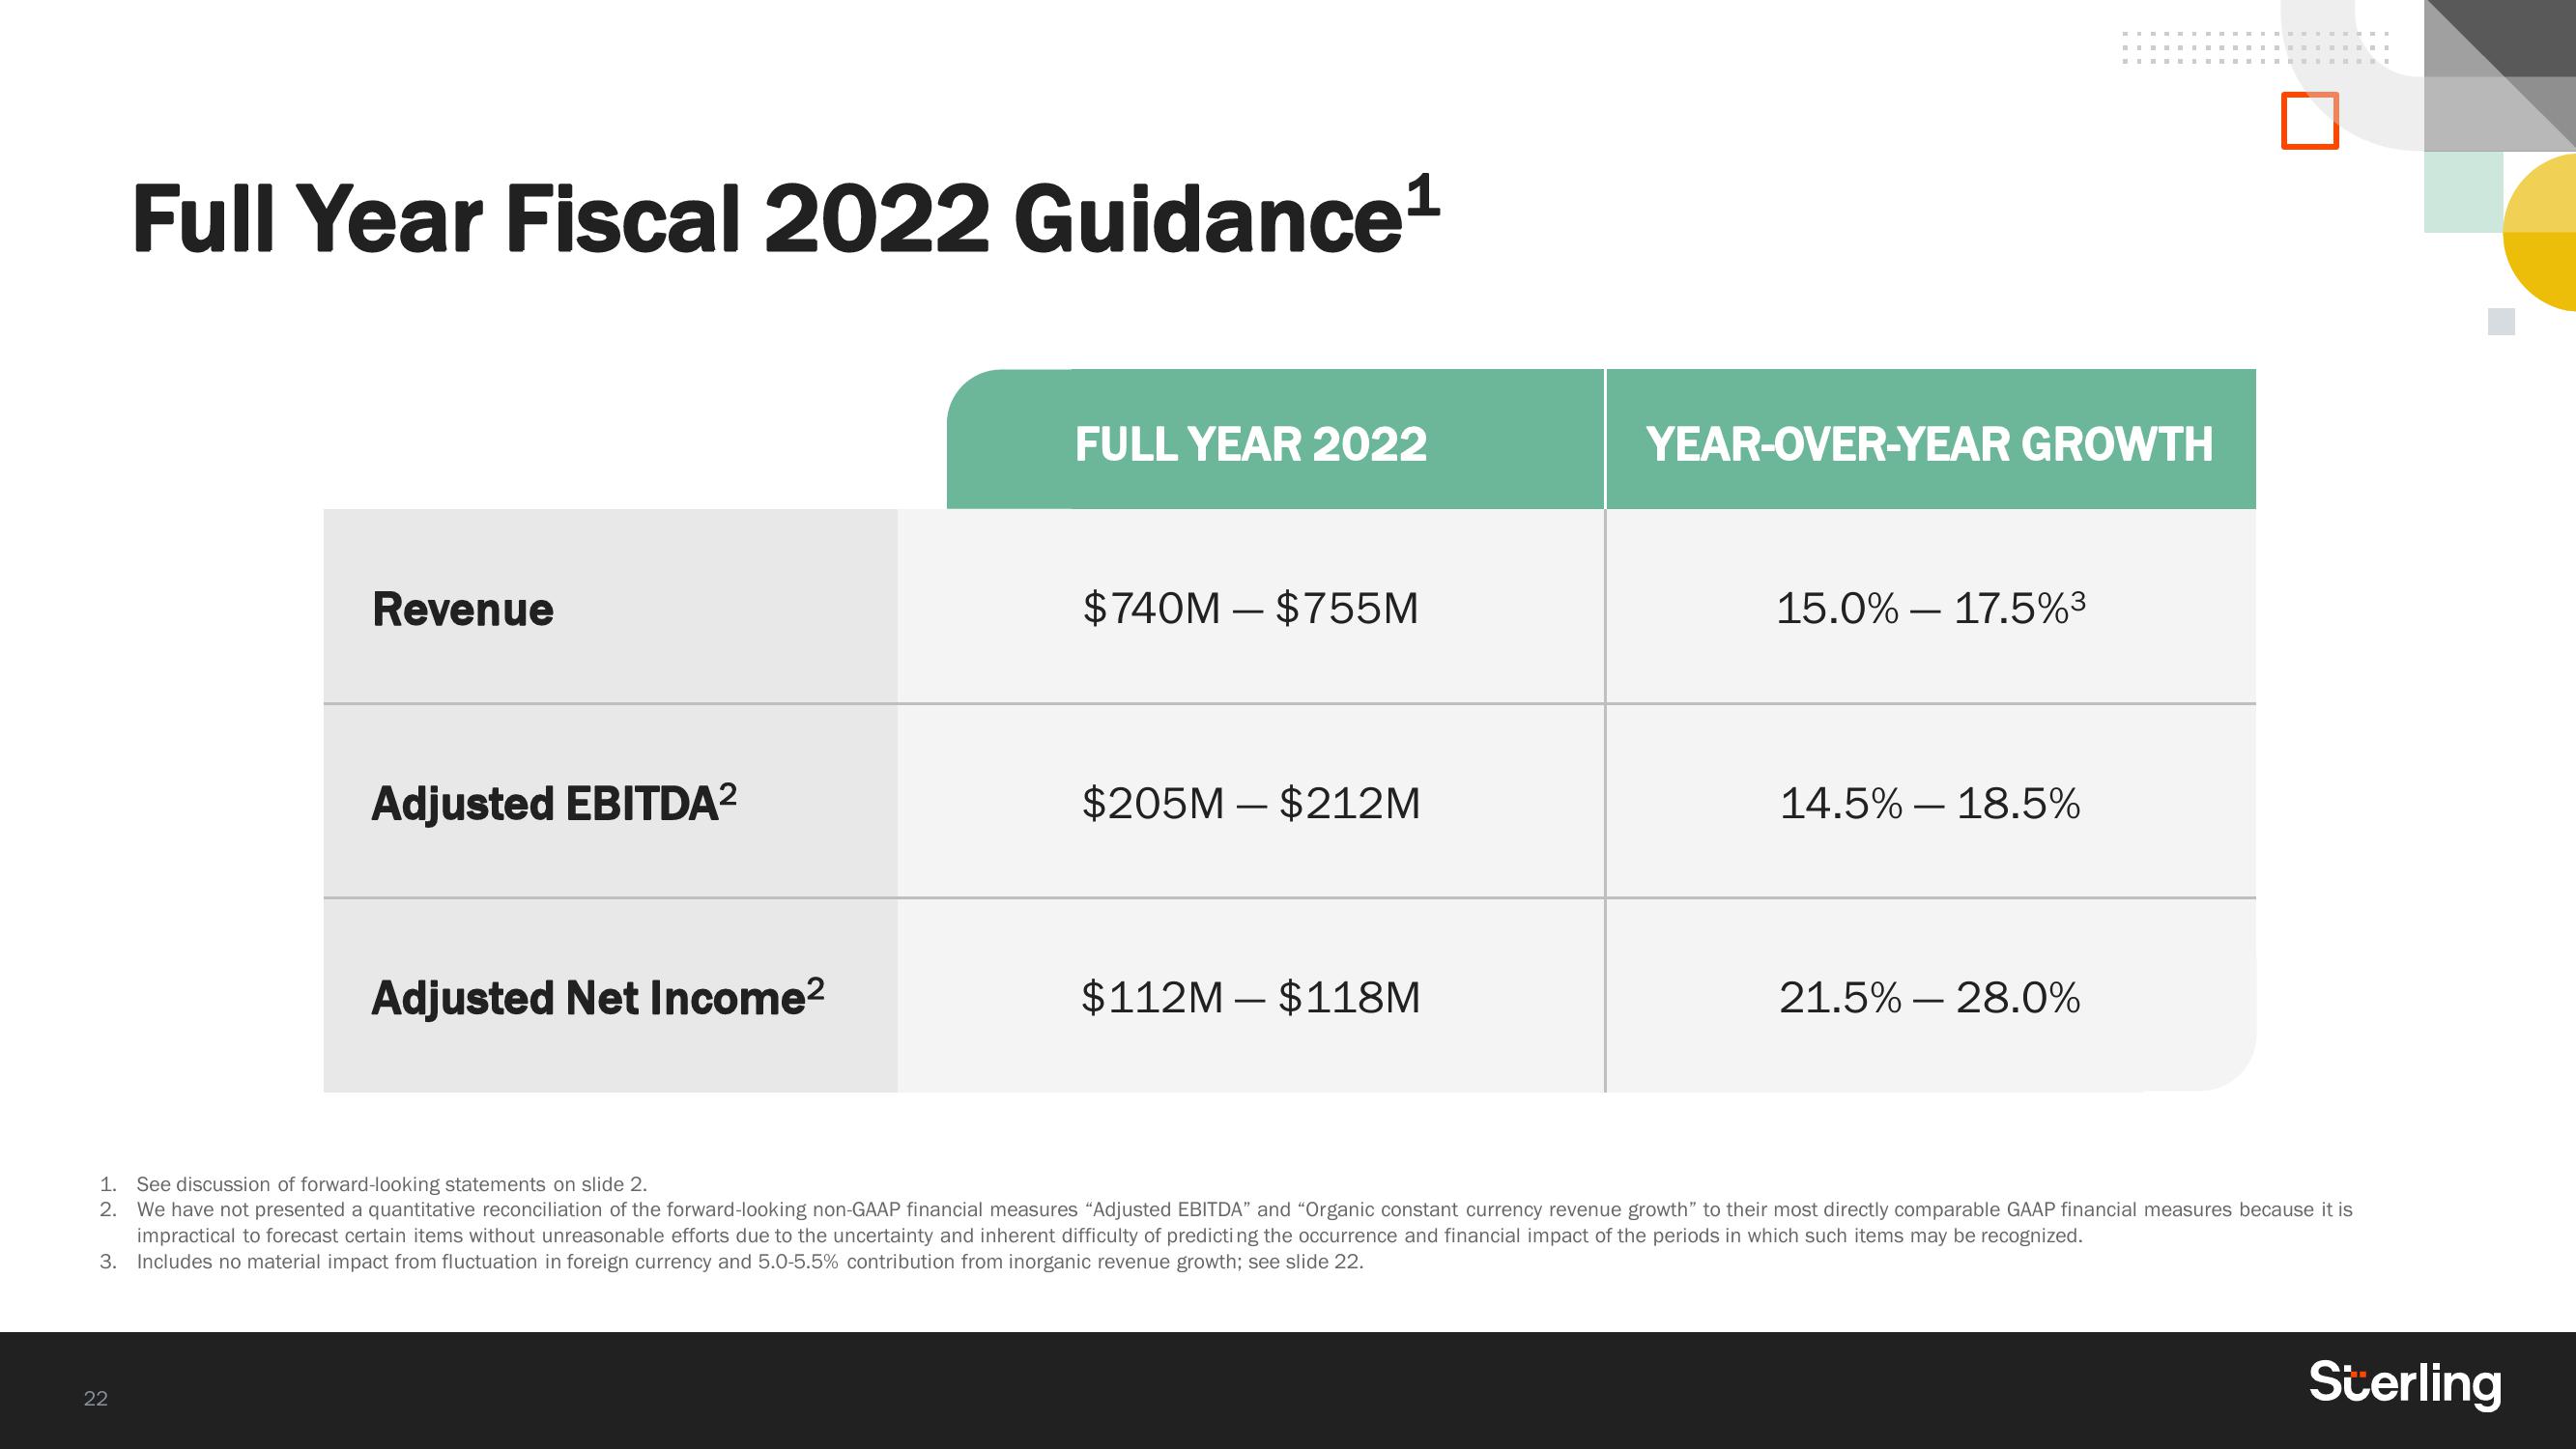
Full Year Fiscal 2022 Guidance¹
22
Revenue
Adjusted EBITDA²
Adjusted Net Income²
FULL YEAR 2022
$740M $755M
-
$205M - $212M
$112M - $118M
YEAR-OVER-YEAR GROWTH
15.0% 17.5%3
-
14.5% 18.5%
21.5% 28.0%
-
1. See discussion of forward-looking statements on slide 2.
2.
We have not presented a quantitative reconciliation of the forward-looking non-GAAP financial measures "Adjusted EBITDA" and "Organic constant currency revenue growth" to their most directly comparable GAAP financial measures because it is
impractical to forecast certain items without unreasonable efforts due to the uncertainty and inherent difficulty of predicting the occurrence and financial impact of the periods in which such items may be recognized.
Includes no material impact from fluctuation in foreign currency and 5.0-5.5% contribution from inorganic revenue growth; see slide 22.
3.
SterlingView entire presentation