TPG Results Presentation Deck
GAAP Statements of Operations
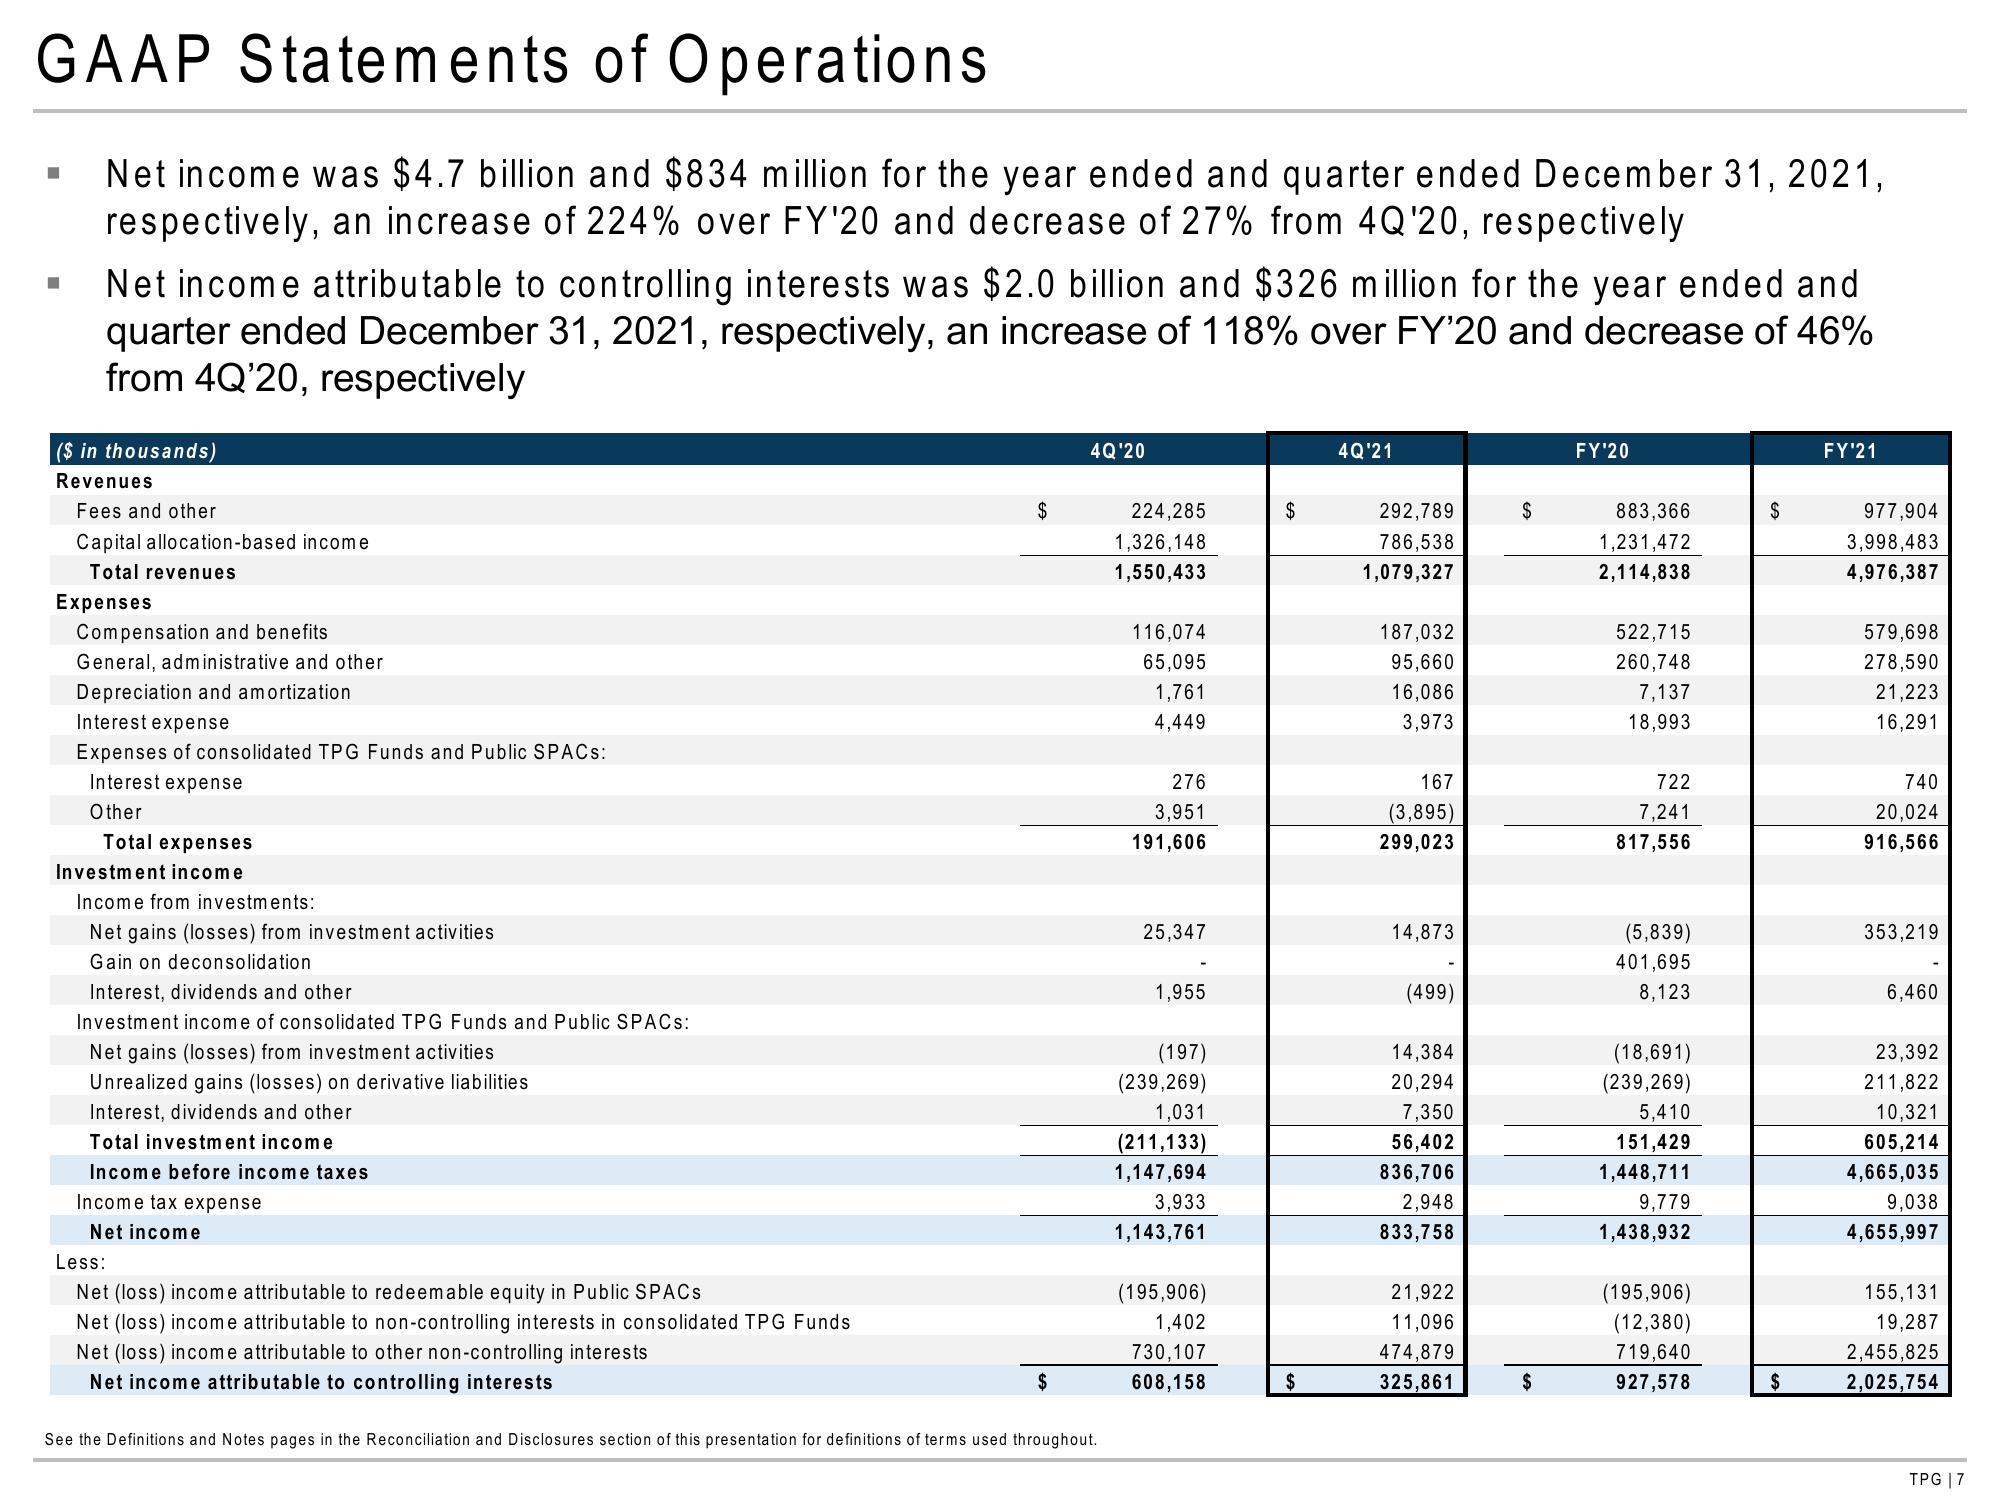
Net income was $4.7 billion and $834 million for the year ended and quarter ended December 31, 2021,
respectively, an increase of 224% over FY'20 and decrease of 27% from 4Q'20, respectively
■
■
Net income attributable to controlling interests was $2.0 billion and $326 million for the year ended and
quarter ended December 31, 2021, respectively, an increase of 118% over FY'20 and decrease of 46%
from 4Q'20, respectively
($ in thousands)
Revenues
Fees and other
Capital allocation-based income
Total revenues
Expenses
Compensation and benefits
General, administrative and other
Depreciation and amortization
Interest expense
Expenses of consolidated TPG Funds and Public SPACs:
Interest expense
Other
Total expenses
Investment income
Income from investments:
Net gains (losses) from investment activities
Gain on deconsolidation
19-222
Interest, dividends and other
Investment income of consolidated TPG Funds and Public SPACs:
Net gains (losses) from investment activities
Unrealized gains (losses) on derivative liabilities
Interest, dividends and other
Total investment income
Income before income taxes
Income tax expense
Net income
Less:
Net (loss) income attributable to redeemable equity in Public SPACs
Net (loss) income attributable to non-controlling interests in consolidated TPG Funds
Net (loss) income attributable to other non-controlling interests
Net income attributable to controlling interests
$
$
4Q'20
See the Definitions and Notes pages in the Reconciliation and Disclosures section of this presentation for definitions of terms used throughout.
224,285
1,326,148
1,550,433
116,074
65,095
1,761
4,449
276
3,951
191,606
25,347
1,955
(197)
(239,269)
1,031
(211,133)
1,147,694
3,933
1,143,761
(195,906)
1,402
730,107
608,158
$
$
4Q'21
292,789
786,538
1,079,327
187,032
95,660
16,086
3,973
167
(3,895)
299,023
14,873
(499)
14,384
20,294
7,350
56,402
836,706
2,948
833,758
21,922
11,096
474,879
325,861
$
$
FY'20
883,366
1,231,472
2,114,838
522,715
260,748
7,137
18,993
722
7,241
817,556
(5,839)
401,695
8,123
(18,691)
(239,269)
5,410
151,429
1,448,711
9,779
1,438,932
(195,906)
(12,380)
719,640
927,578
$
$
FY'21
977,904
3,998,483
4,976,387
579,698
278,590
21,223
16,291
740
20,024
916,566
353,219
6,460
23,392
211,822
10,321
605,214
4,665,035
9,038
4,655,997
155,131
19,287
2,455,825
2,025,754
TPG | 7View entire presentation