Hexagon Purus Results Presentation Deck
33
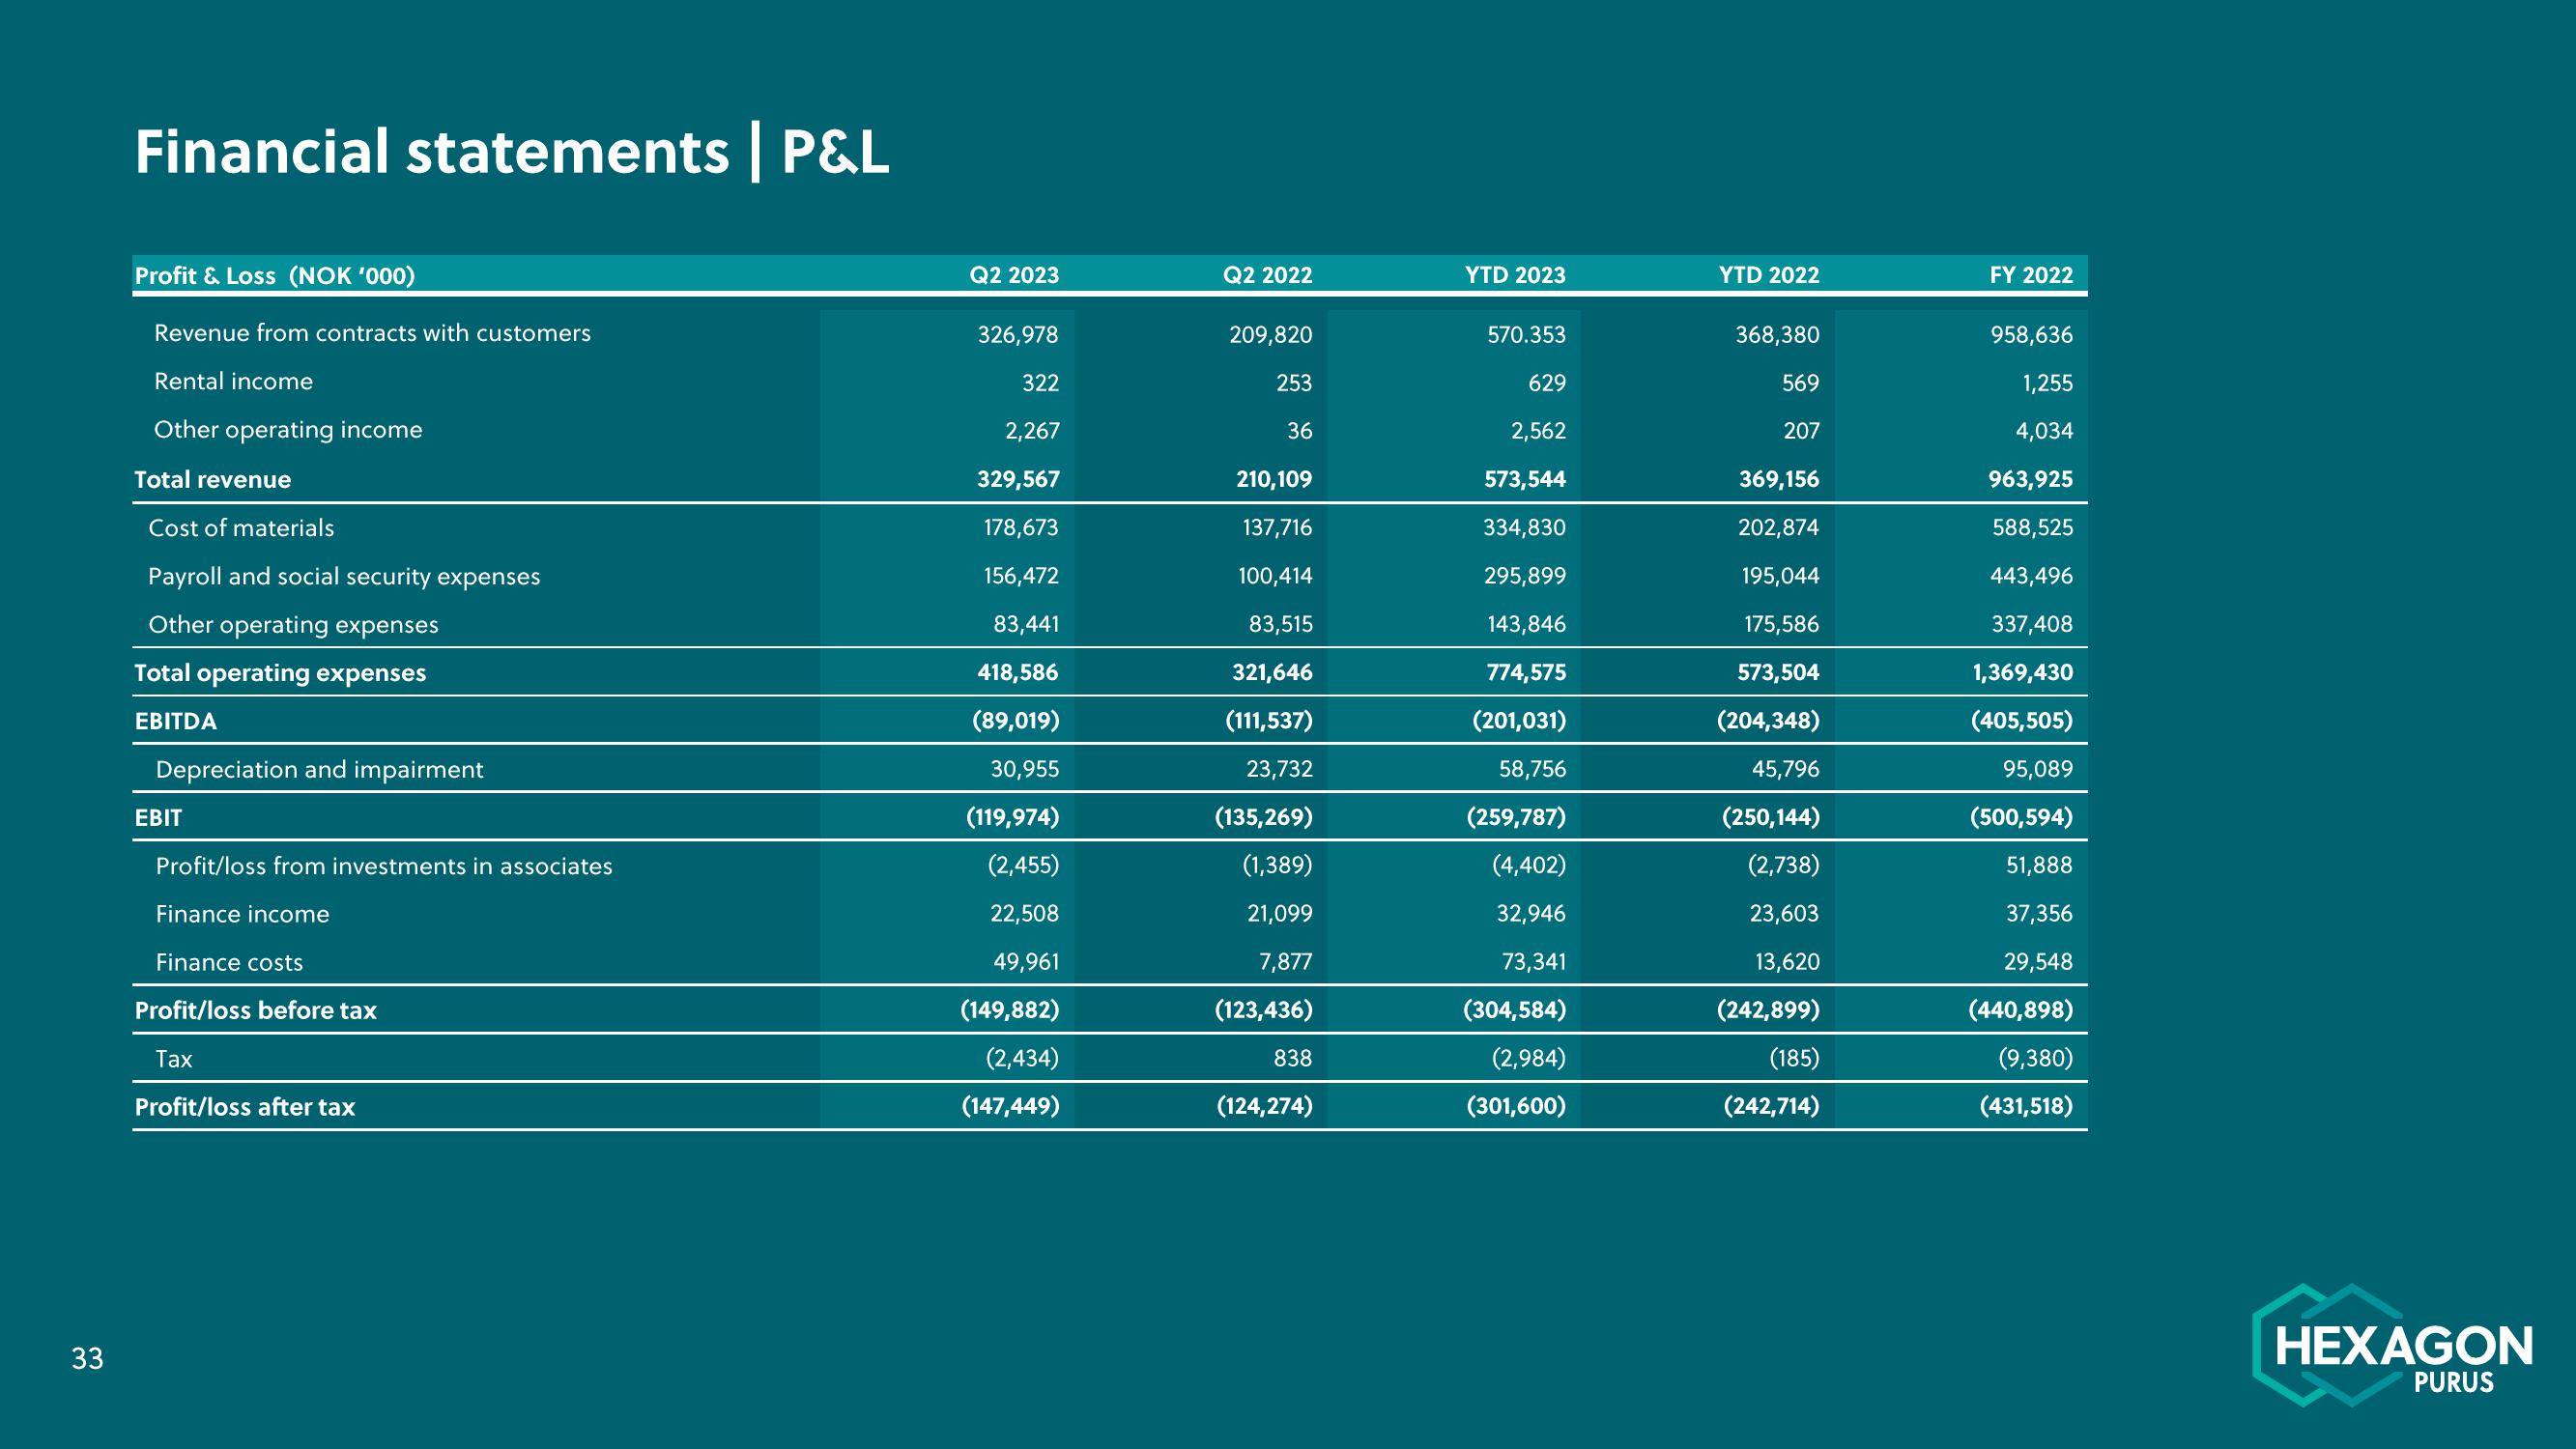
Financial statements | P&L
Profit & Loss (NOK '000)
Revenue from contracts with customers
Rental income
Other operating income
Total revenue
Cost of materials
Payroll and social security expenses
Other operating expenses
Total operating expenses
EBITDA
Depreciation and impairment
EBIT
Profit/loss from investments in associates
Finance income
Finance costs
Profit/loss before tax
Tax
Profit/loss after tax
Q2 2023
326,978
322
2,267
329,567
178,673
156,472
83,441
418,586
(89,019)
30,955
(119,974)
(2,455)
22,508
49,961
(149,882)
(2,434)
(147,449)
Q2 2022
209,820
253
36
210,109
137,716
100,414
83,515
321,646
(111,537)
23,732
(135,269)
(1,389)
21,099
7,877
(123,436)
838
(124,274)
YTD 2023
570.353
629
2,562
573,544
334,830
295,899
143,846
774,575
(201,031)
58,756
(259,787)
(4,402)
32,946
73,341
(304,584)
(2,984)
(301,600)
YTD 2022
368,380
569
207
369,156
202,874
195,044
175,586
573,504
(204,348)
45,796
(250,144)
(2,738)
23,603
13,620
(242,899)
(185)
(242,714)
FY 2022
958,636
1,255
4,034
963,925
588,525
443,496
337,408
1,369,430
(405,505)
95,089
(500,594)
51,888
37,356
29,548
(440,898)
(9,380)
(431,518)
HEXAGON
PURUSView entire presentation