Bank of America Results Presentation Deck
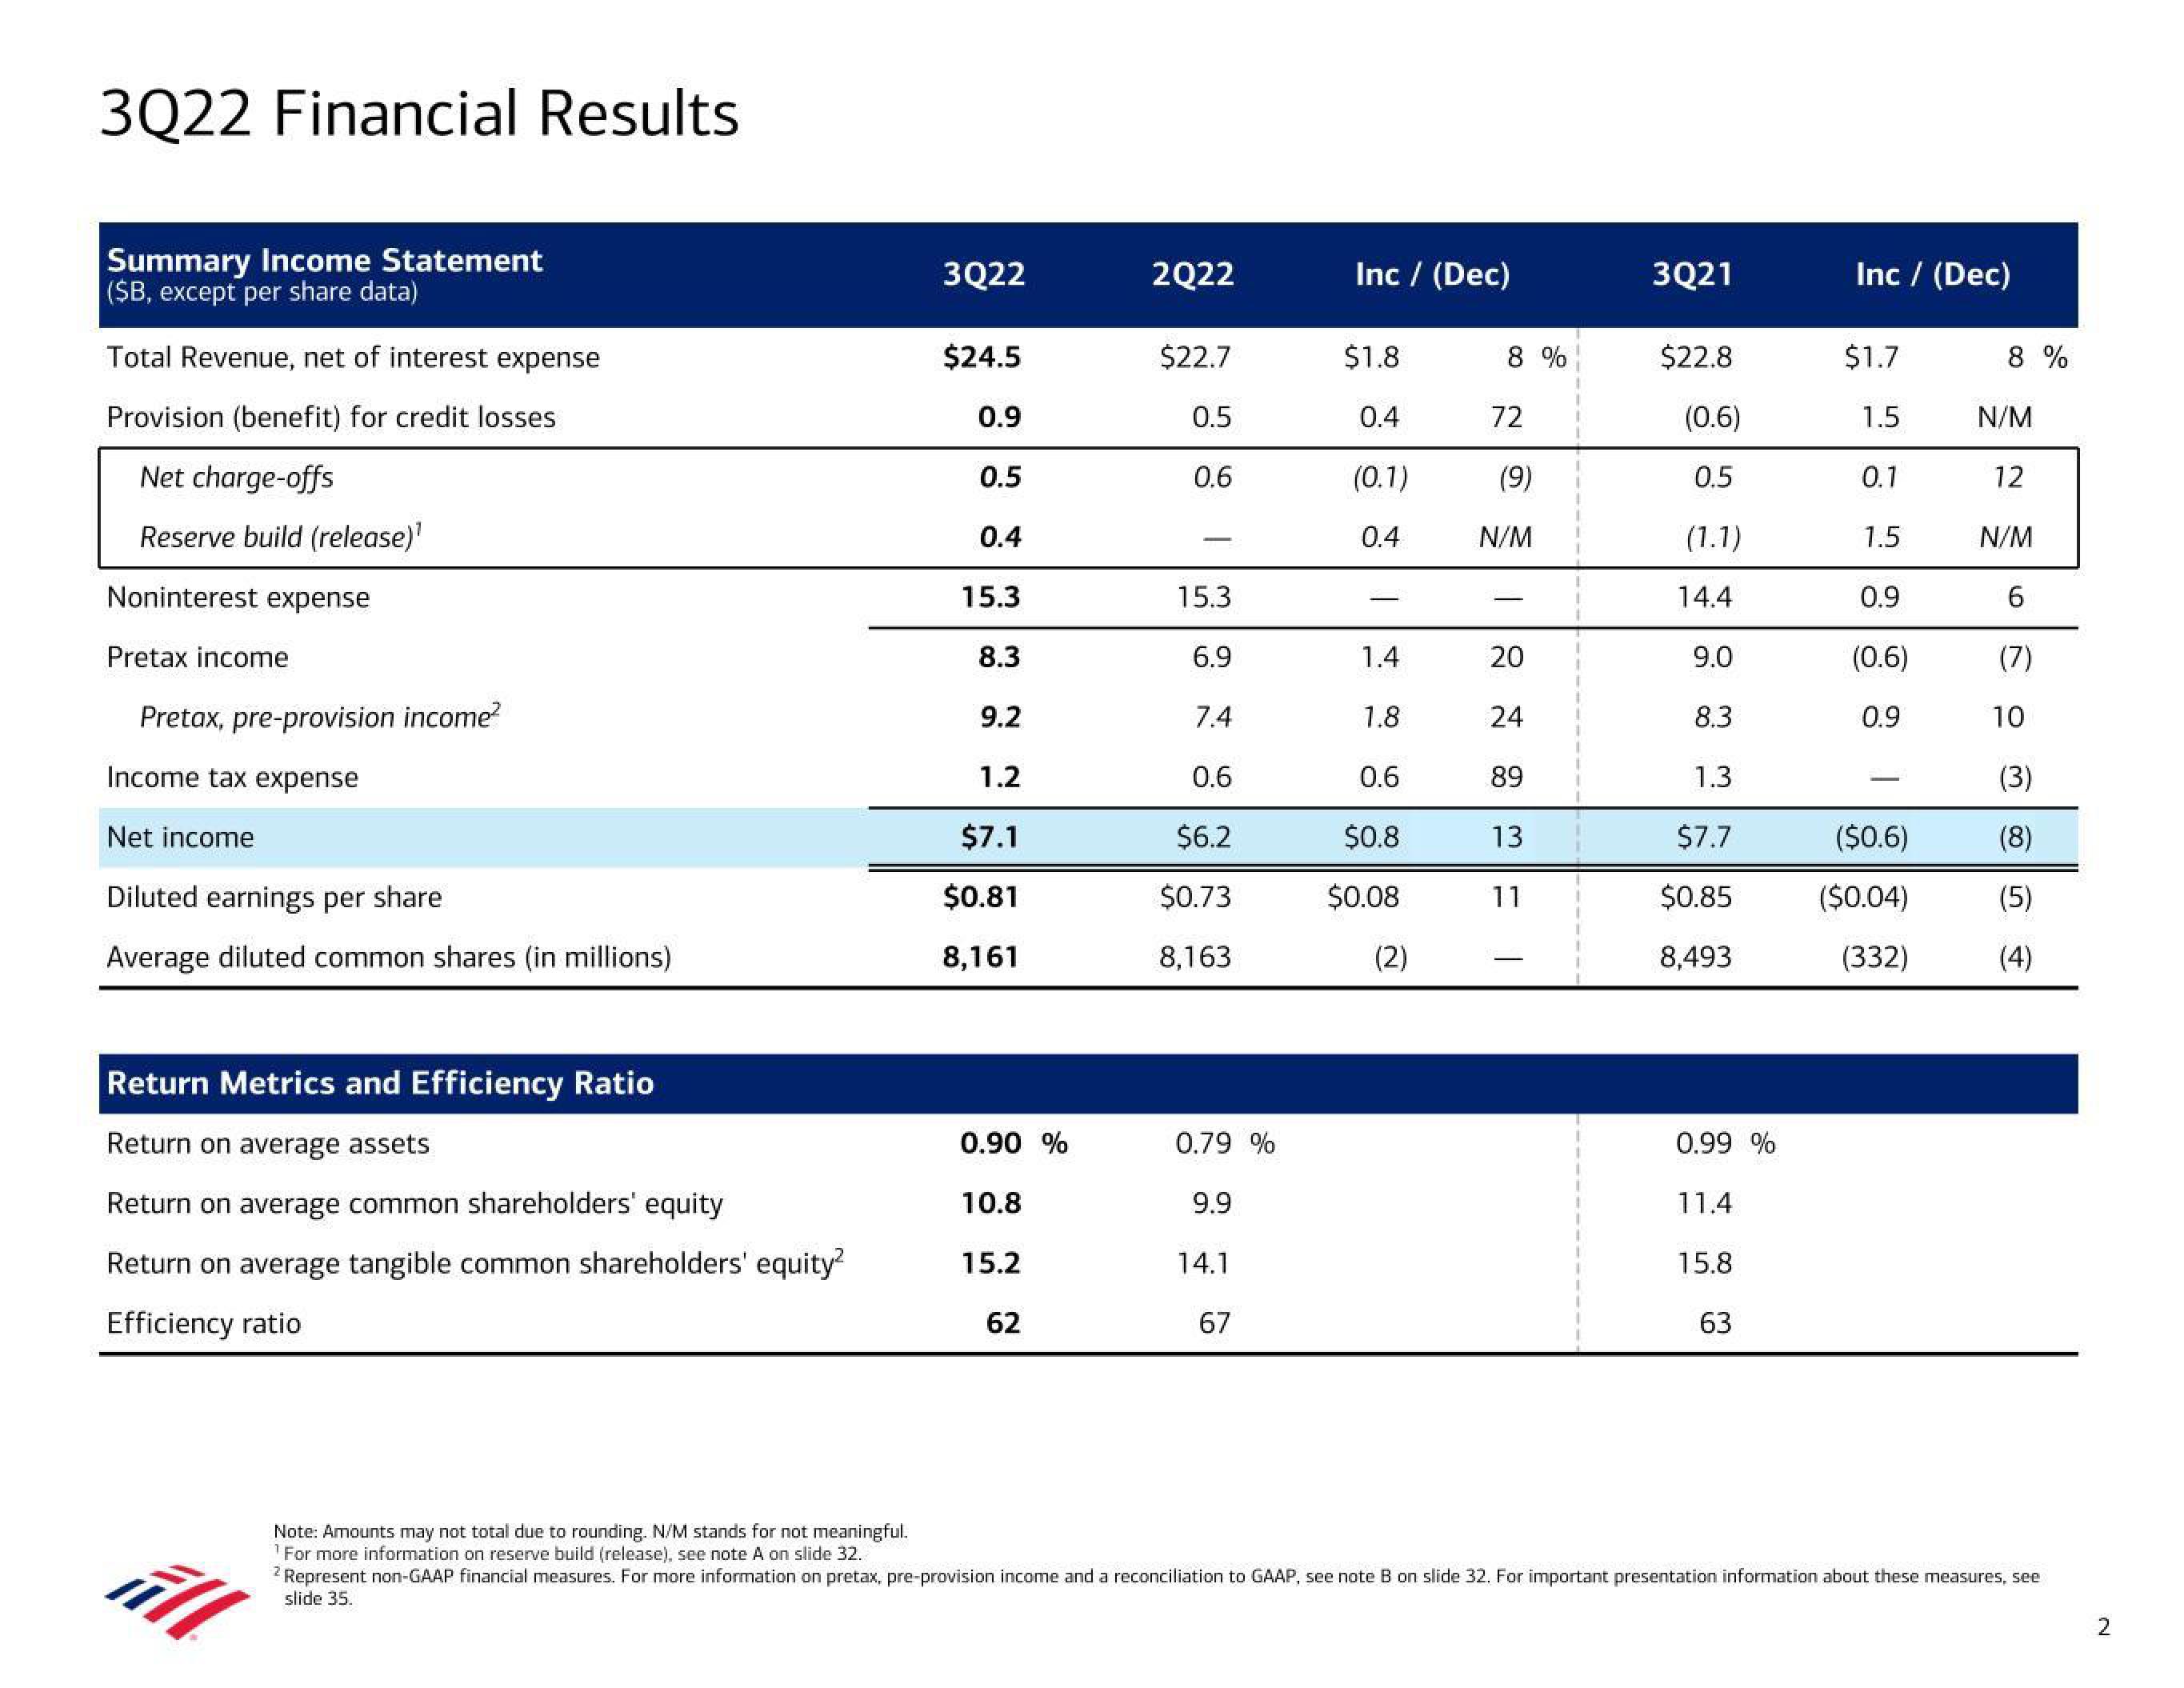
3Q22 Financial Results
Summary Income Statement
($B, except per share data)
Total Revenue, net of interest expense
Provision (benefit) for credit losses
Net charge-offs
Reserve build (release)¹
Noninterest expense
Pretax income
Pretax, pre-provision income²
Income tax expense
Net income
Diluted earnings per share
Average diluted common shares (in millions)
Return Metrics and Efficiency Ratio
Return on average assets
Return on average common shareholders' equity
Return on average tangible common shareholders' equity²
Efficiency ratio
3Q22
$24.5
0.9
0.5
0.4
15.3
8.3
9.2
1.2
$7.1
$0.81
8,161
0.90 %
10.8
15.2
62
2Q22
$22.7
0.5
0.6
15.3
6.9
7.4
0.6
$6.2
$0.73
8,163
0.79 %
9.9
14.1
67
Inc / (Dec)
$1.8
0.4
(0.1)
0.4
1.4
1.8
0.6
$0.8
$0.08
(2)
8 %
72
(9)
N/M
20
24
89
13
11
T
3Q21
$22.8
(0.6)
0.5
(1.1)
14.4
9.0
8.3
1.3
$7.7
$0.85
8,493
0.99 %
11.4
15.8
63
Inc / (Dec)
$1.7
1.5
0.1
1.5
0.9
(0.6)
0.9
($0.6)
($0.04)
(332)
8%
N/M
12
N/M
6
(7)
10
(3)
(8)
(5)
(4)
Note: Amounts may not total due to rounding. N/M stands for not meaningful.
For more information on reserve build (release), see note A on slide 32.
All
2 Represent non-GAAP financial measures. For more information on pretax, pre-provision income and a reconciliation to GAAP, see note B on slide 32. For important presentation information about these measures, see
slide 35.
2View entire presentation