Nestle Results Presentation Deck
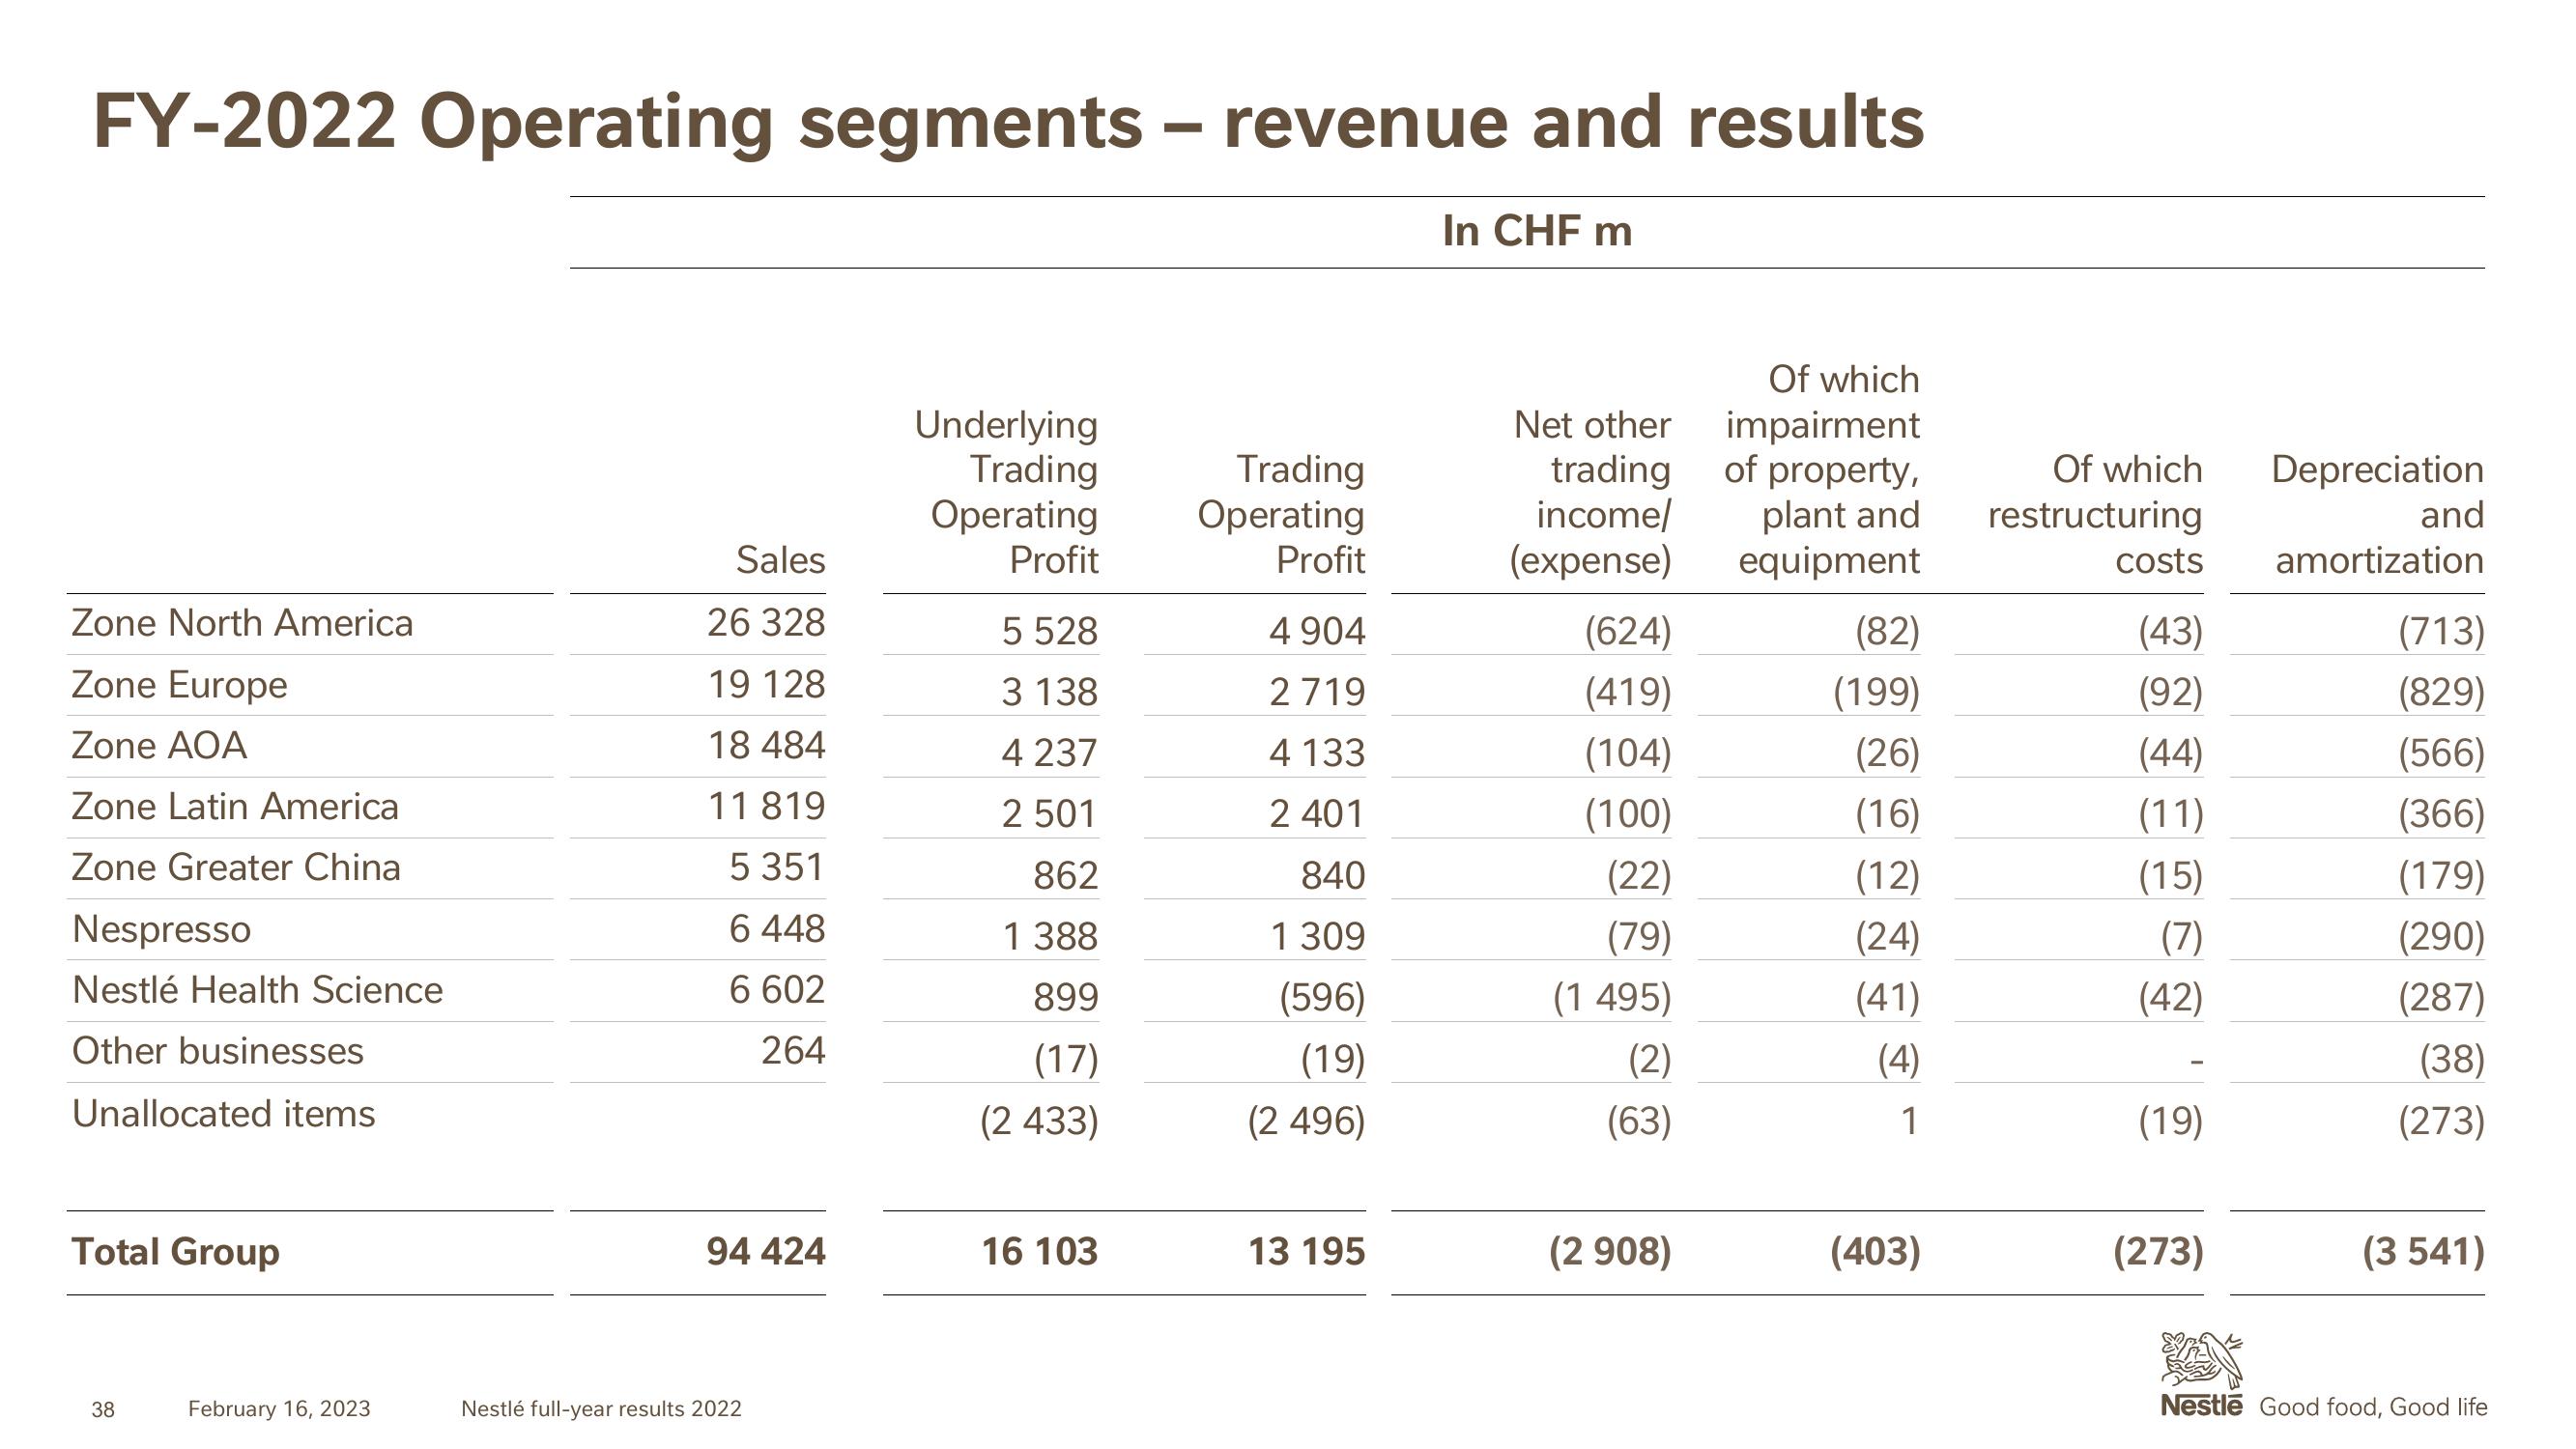
FY-2022 Operating segments - revenue and results
In CHF m
Zone North America
Zone Europe
Zone AOA
Zone Latin America
Zone Greater China
Nespresso
Nestlé Health Science
Other businesses
Unallocated items
Total Group
38
February 16, 2023
Sales
26 328
19 128
18 484
11 819
5 351
6 448
6 602
264
94 424
Nestlé full-year results 2022
Underlying
Trading
Operating
Profit
5 528
3 138
4 237
2 501
862
1 388
899
(17)
(2 433)
16 103
Trading
Operating
Profit
4 904
2719
4 133
2 401
840
1 309
(596)
(19)
(2 496)
13 195
Net other
trading
income/
(expense)
(624)
(419)
(104)
(100)
(22)
(79)
(1 495)
(2)
(63)
(2 908)
Of which
impairment
of property,
plant and
equipment
(82)
(199)
(26)
(16)
(12)
(24)
(41)
(4)
1
(403)
Of which
restructuring
costs
(43)
(92)
(44)
(11)
(15)
(7)
(42)
(19)
(273)
Depreciation
and
amortization
(713)
(829)
(566)
(366)
(179)
(290)
(287)
(38)
(273)
(3 541)
Nestle Good food, Good lifeView entire presentation