Oatly Results Presentation Deck
Q2 2021 FINANCIALS OVERVIEW
CONTINUED TOPLINE MOMENTUM EXPECTED TO FURTHER ACCELERATE AS CAPACITY INCREASES
ADJ. EBITDA (3)
CAPEX
Production
volume (1)
Sales volume(1)
●
●
74
67
●
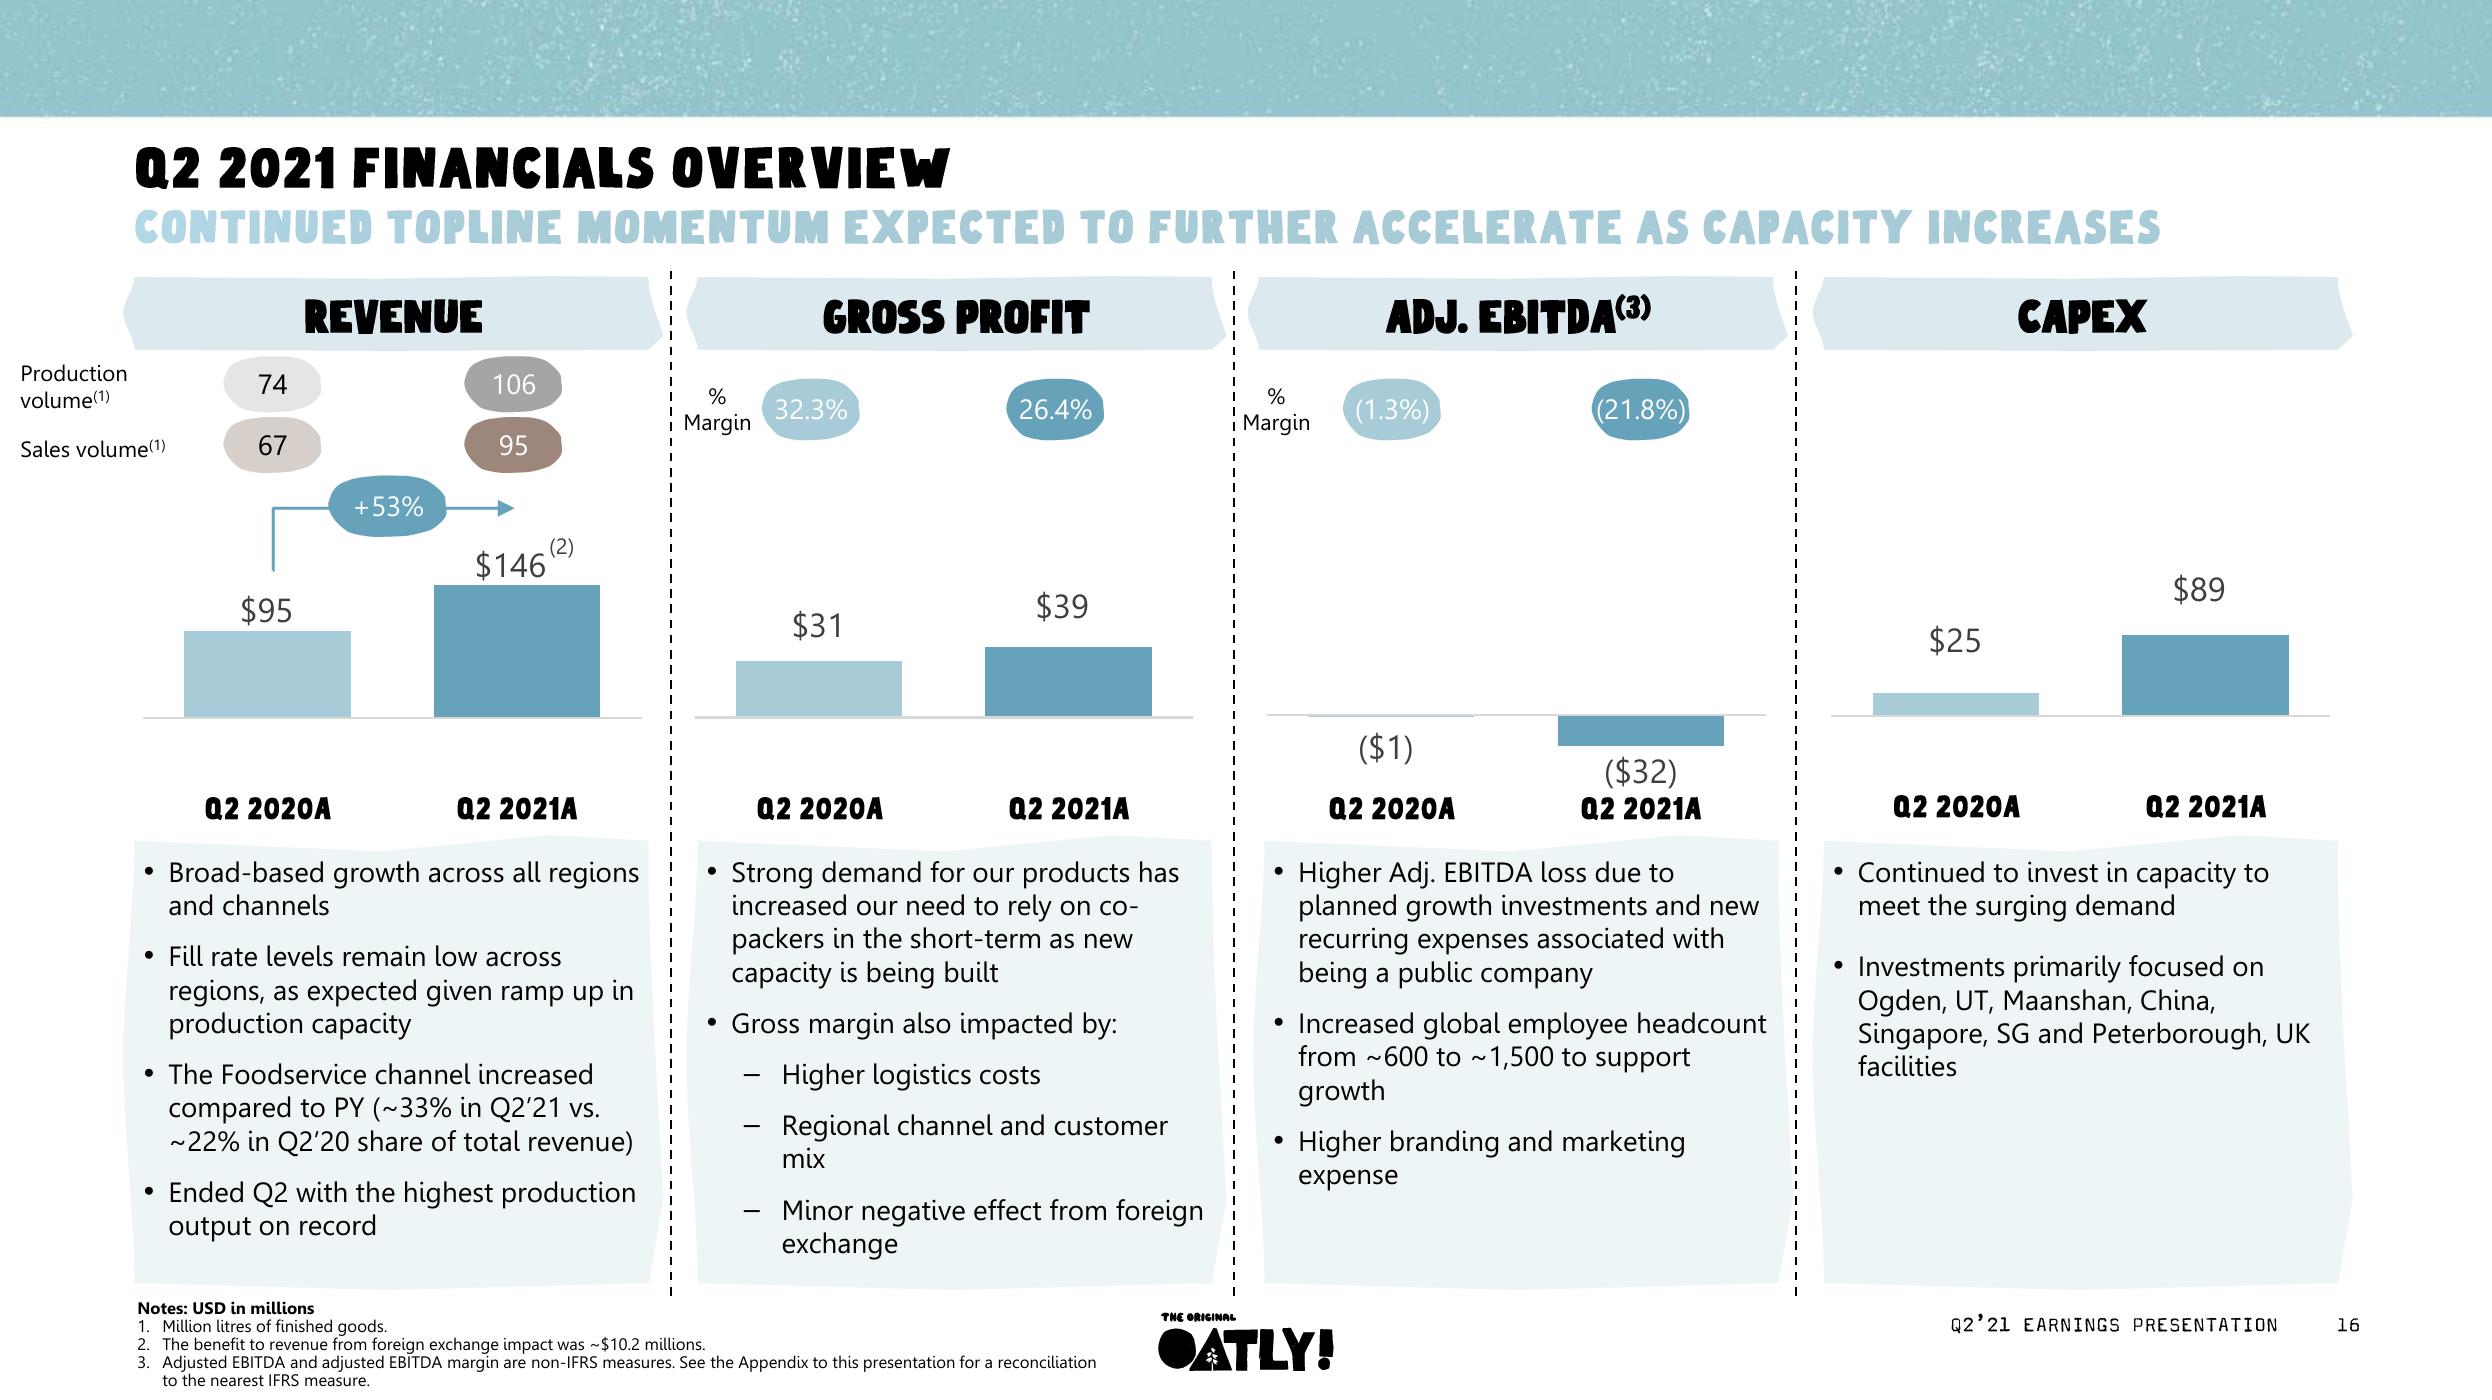
$95
REVENUE
+53%
Q2 2020A
106
95
$146
Q2 2021A
Broad-based growth across all regions
and channels
• Fill rate levels remain low across
regions, as expected given ramp up in
production capacity
The Foodservice channel increased
compared to PY (~33% in Q2'21 vs.
~22% in Q2'20 share of total revenue)
Ended Q2 with the highest production
output on record
%
Margin
●
●
-
-
GROSS PROFIT
-
32.3%
$31
Q2 2020A
Strong demand for our products has
increased our need to rely on co-
packers in the short-term as new
capacity is being built
Gross margin also impacted by:
Higher logistics costs
26.4%
$39
Q2 2021A
Regional channel and customer
mix
Minor negative effect from foreign
exchange
Notes: USD in millions
1. Million litres of finished goods.
2. The benefit to revenue from foreign exchange impact was ~$10.2 millions.
3. Adjusted EBITDA and adjusted EBITDA margin are non-IFRS measures. See the Appendix to this presentation for a reconciliation
to the nearest IFRS measure.
THE ORIGINAL
%
Margin
●
(1.3%)
(21.8%)
($1)
Q2 2020A
Higher Adj. EBITDA loss due to
planned growth investments and new
recurring expenses associated with
being a public company
●ATLY!
($32)
Q2 2021A
• Increased global employee headcount
from ~600 to ~1,500 to support
growth
Higher branding and marketing
expense
$25
$89
Q2 2021A
Q2 2020A
• Continued to invest in capacity to
meet the surging demand
• Investments primarily focused on
Ogden, UT, Maanshan, China,
Singapore, SG and Peterborough, UK
facilities
Q2'21 EARNINGS PRESENTATION
16View entire presentation