Diageo Results Presentation Deck
DELIVERING SUSTAINABLE LONG-TERM GROWTH 1 Accelerating top line growth
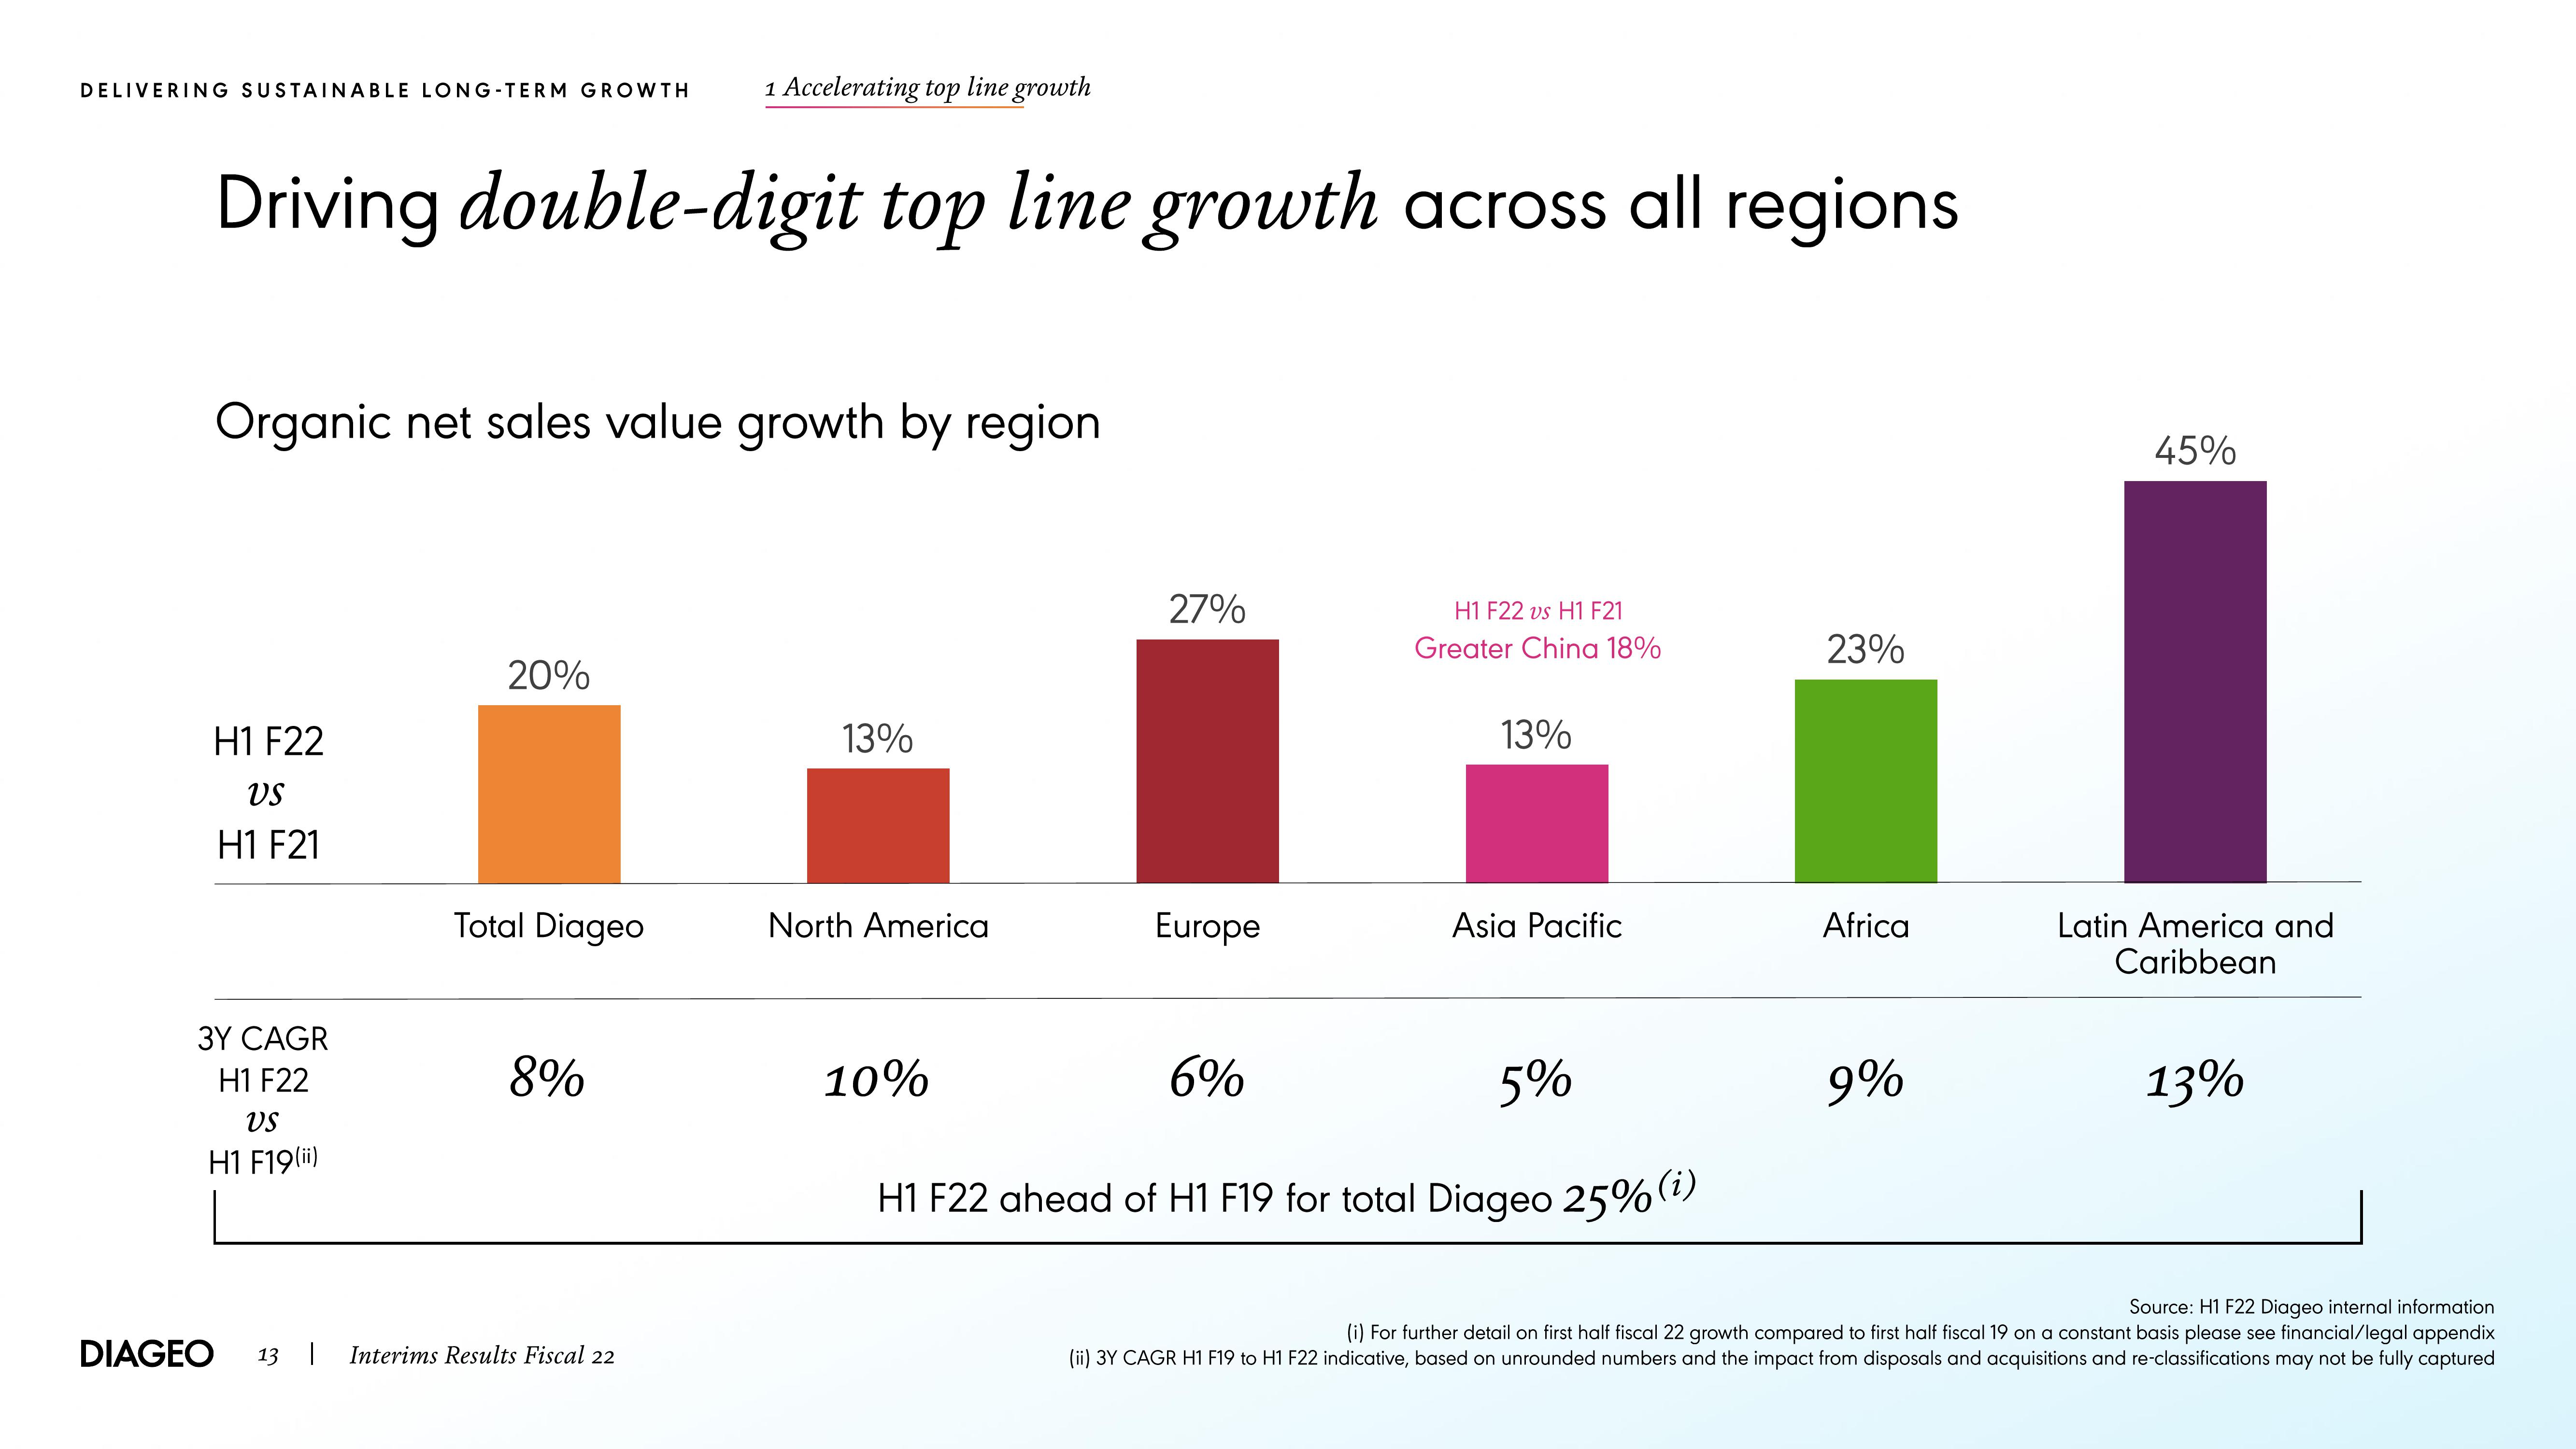
Driving double-digit top line growth across all regions
Organic net sales value growth by region
H1 F22
VS
H1F21
3Y CAGR
H1 F22
VS
H1 F19(ii)
20%
Total Diageo
8%
DIAGEO 13 | Interims Results Fiscal 22
13%
North America
27%
Europe
6%
H1 F22 vs H1 F21
Greater China 18%
13%
Asia Pacific
10%
5%
H1 F22 ahead of H1 F19 for total Diageo 25% (i)
23%
Africa
9%
45%
Latin America and
Caribbean
13%
Source: H1 F22 Diageo internal information
(i) For further detail on first half fiscal 22 growth compared to first half fiscal 19 on a constant basis please see financial/legal appendix
(ii) 3Y CAGR H1 F19 to H1 F22 indicative, based on unrounded numbers and the impact from disposals and acquisitions and re-classifications may not be fully capturedView entire presentation