UBS Results Presentation Deck
Global Wealth Management
Profit before tax
m
Operating
income
m
Cost/income ratio
Invested assets
end of period, bn
UBS
Transaction-based
income
Net interest
income
Recurring net fee
income
Fee-generating
assets
1,057
4,280
863
962
2,341
22
Other
76%
2,754
1,163
3Q20
864
4,277
776
1,011
80%
2,468
2,629
3
7
Credit loss (expenses)/releases
3,016
+43%
1,409
1,277
4Q20
+17%
4,848
1,183
997
71%
+16%
3,108
1,328
1Q21
1,294
4,774
953
1,026
2,774
14
73%
3,230
1,416
2Q21
1,516
5,002
894
1,107
2,872
11
70%
3,198
1,412
3Q21
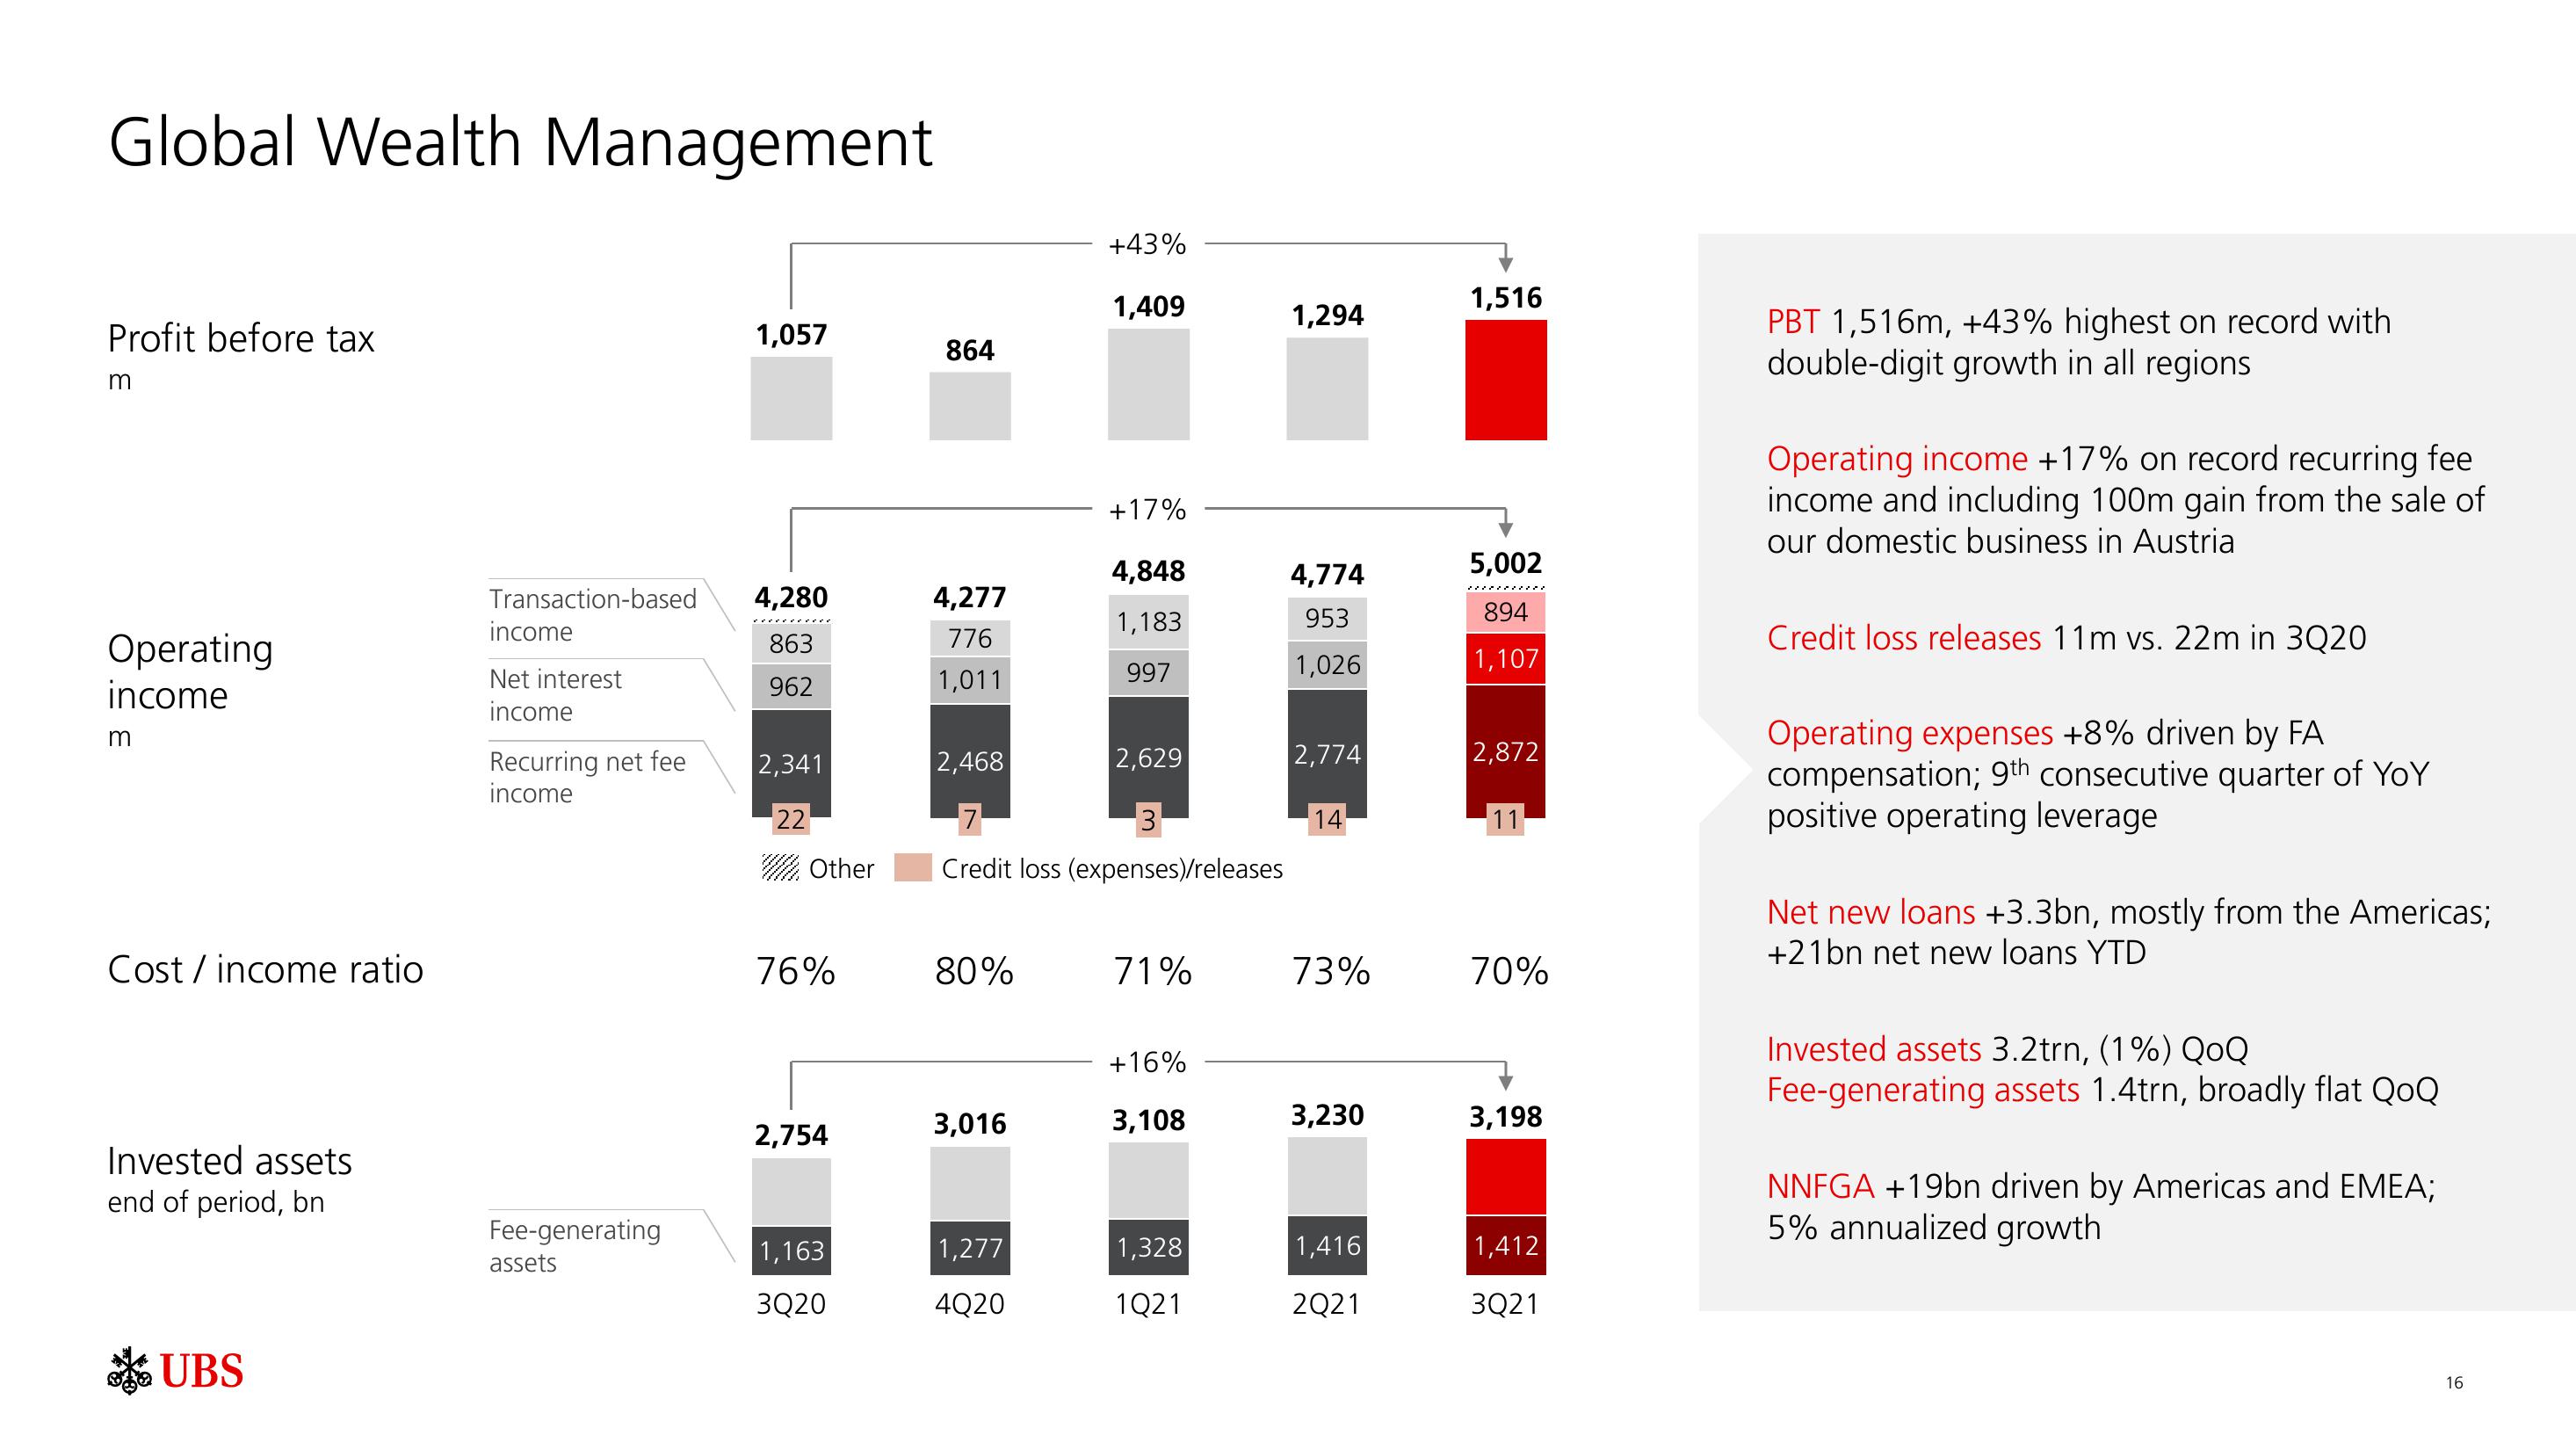
PBT 1,516m, +43% highest on record with
double-digit growth in all regions
Operating income +17% on record recurring fee
income and including 100m gain from the sale of
our domestic business in Austria
Credit loss releases 11m vs. 22m in 3Q20
Operating expenses +8% driven by FA
compensation; 9th consecutive quarter of YoY
positive operating leverage
Net new loans +3.3bn, mostly from the Americas;
+21bn net new loans YTD
Invested assets 3.2trn, (1%) QoQ
Fee-generating assets 1.4trn, broadly flat QoQ
NNFGA +19bn driven by Americas and EMEA;
5% annualized growth
16View entire presentation