Grab SPAC Presentation Deck
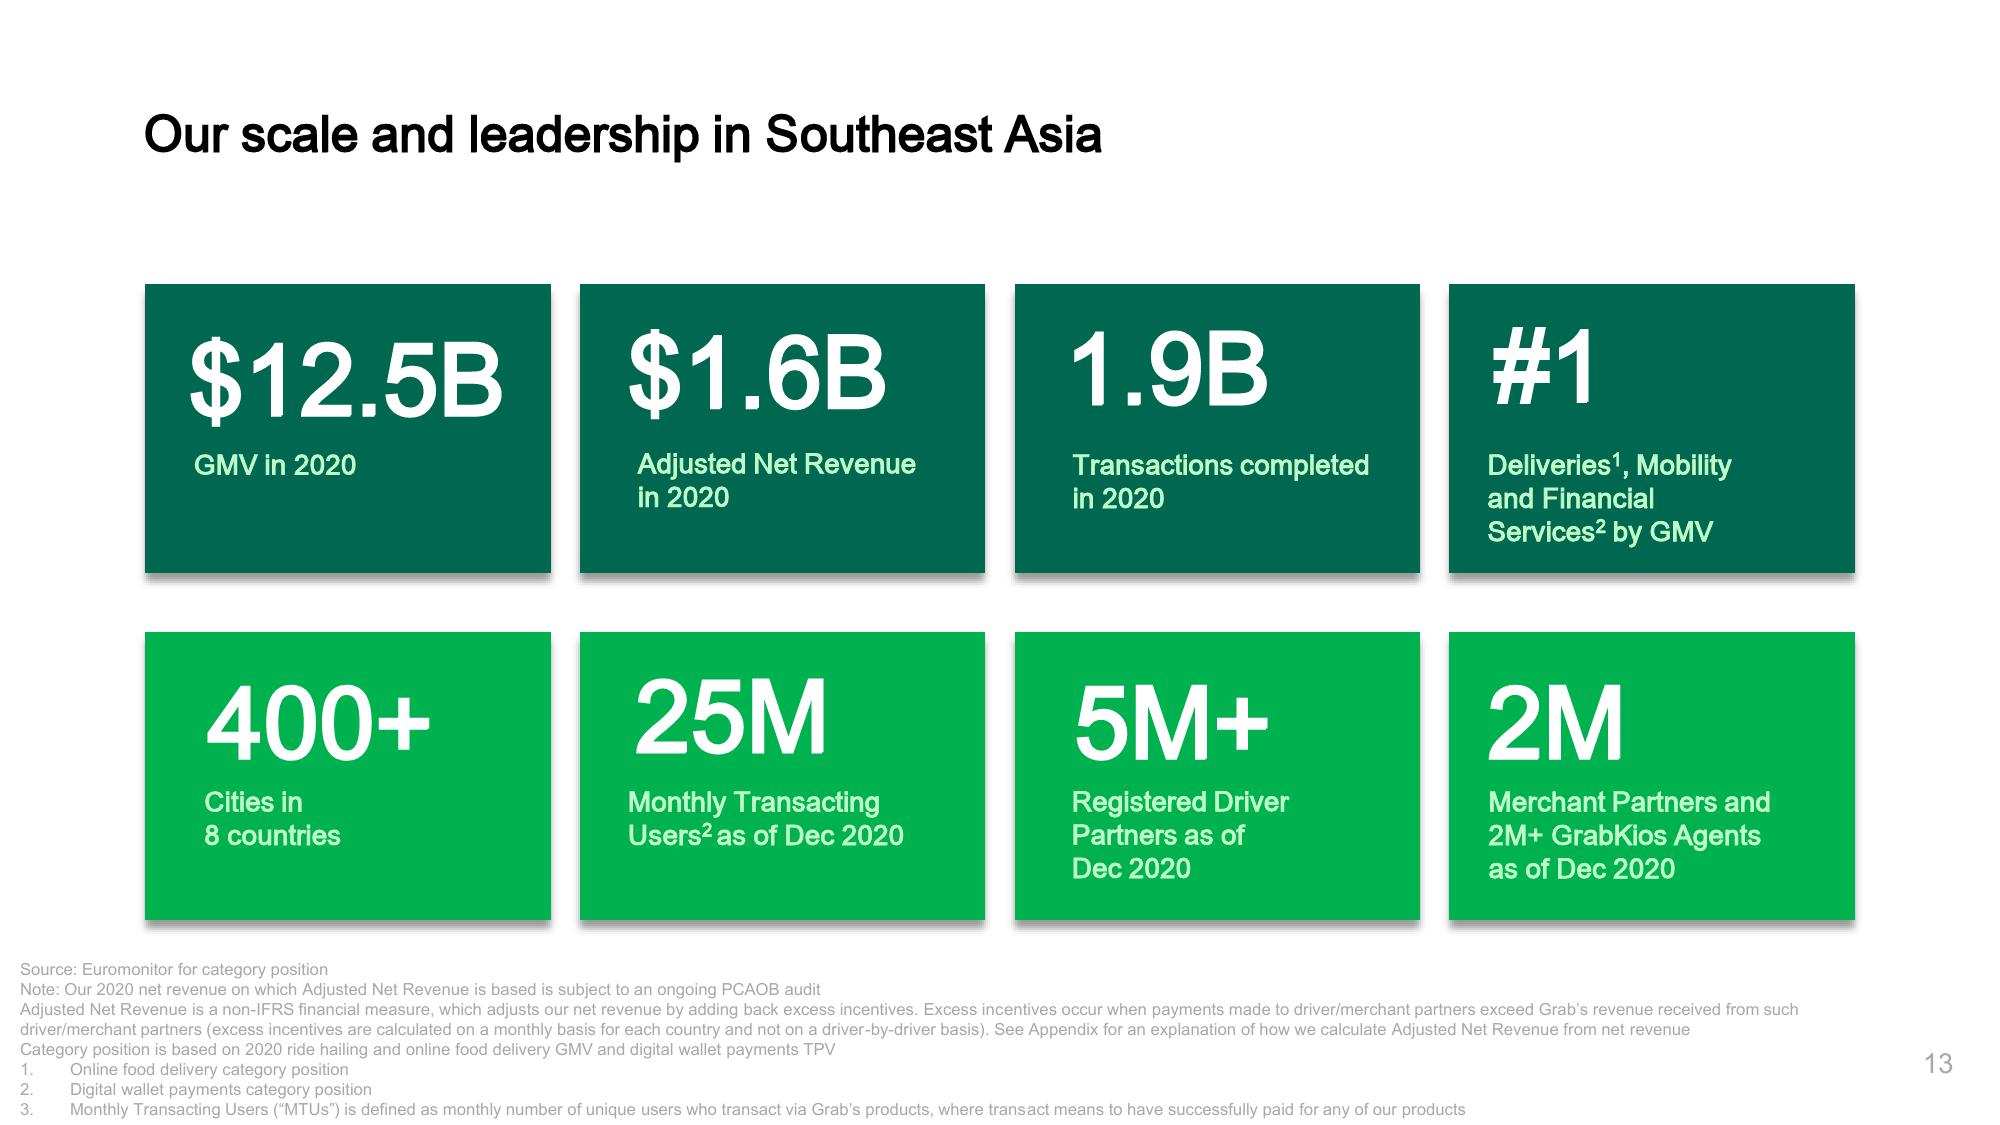
Our scale and leadership in Southeast Asia
$12.5B
GMV in 2020
400+
Cities in
8 countries
$1.6B
Adjusted Net Revenue
in 2020
25M
Monthly Transacting
Users² as of Dec 2020
1.9B
Transactions completed
in 2020
5M+
Registered Driver
Partners as of
Dec 2020
#1
Deliveries ¹, Mobility
and Financial
Services² by GMV
2M
Merchant Partners and
2M+ GrabKios Agents
as of Dec 2020
Source: Euromonitor for category position
Note: Our 2020 net revenue on which Adjusted Net Revenue is based is subject to an ongoing PCAOB audit
Adjusted Net Revenue is a non-IFRS financial measure, which adjusts our net revenue by adding back excess incentives. Excess incentives occur when payments made to driver/merchant partners exceed Grab's revenue received from such
driver/merchant partners (excess incentives are calculated on a monthly basis for each country and not on a driver-by-driver basis). See Appendix for an explanation of how we calculate Adjusted Net Revenue from net revenue
Category position is based on 2020 ride hailing and online food delivery GMV and digital wallet payments TPV
1.
Online food delivery category position
2. Digital wallet payments category position
3. Monthly Transacting Users ("MTUS") is defined as monthly number of unique users who transact via Grab's products, where transact means to have successfully paid for any of our products
13View entire presentation