JD Sports Results Presentation Deck
JD
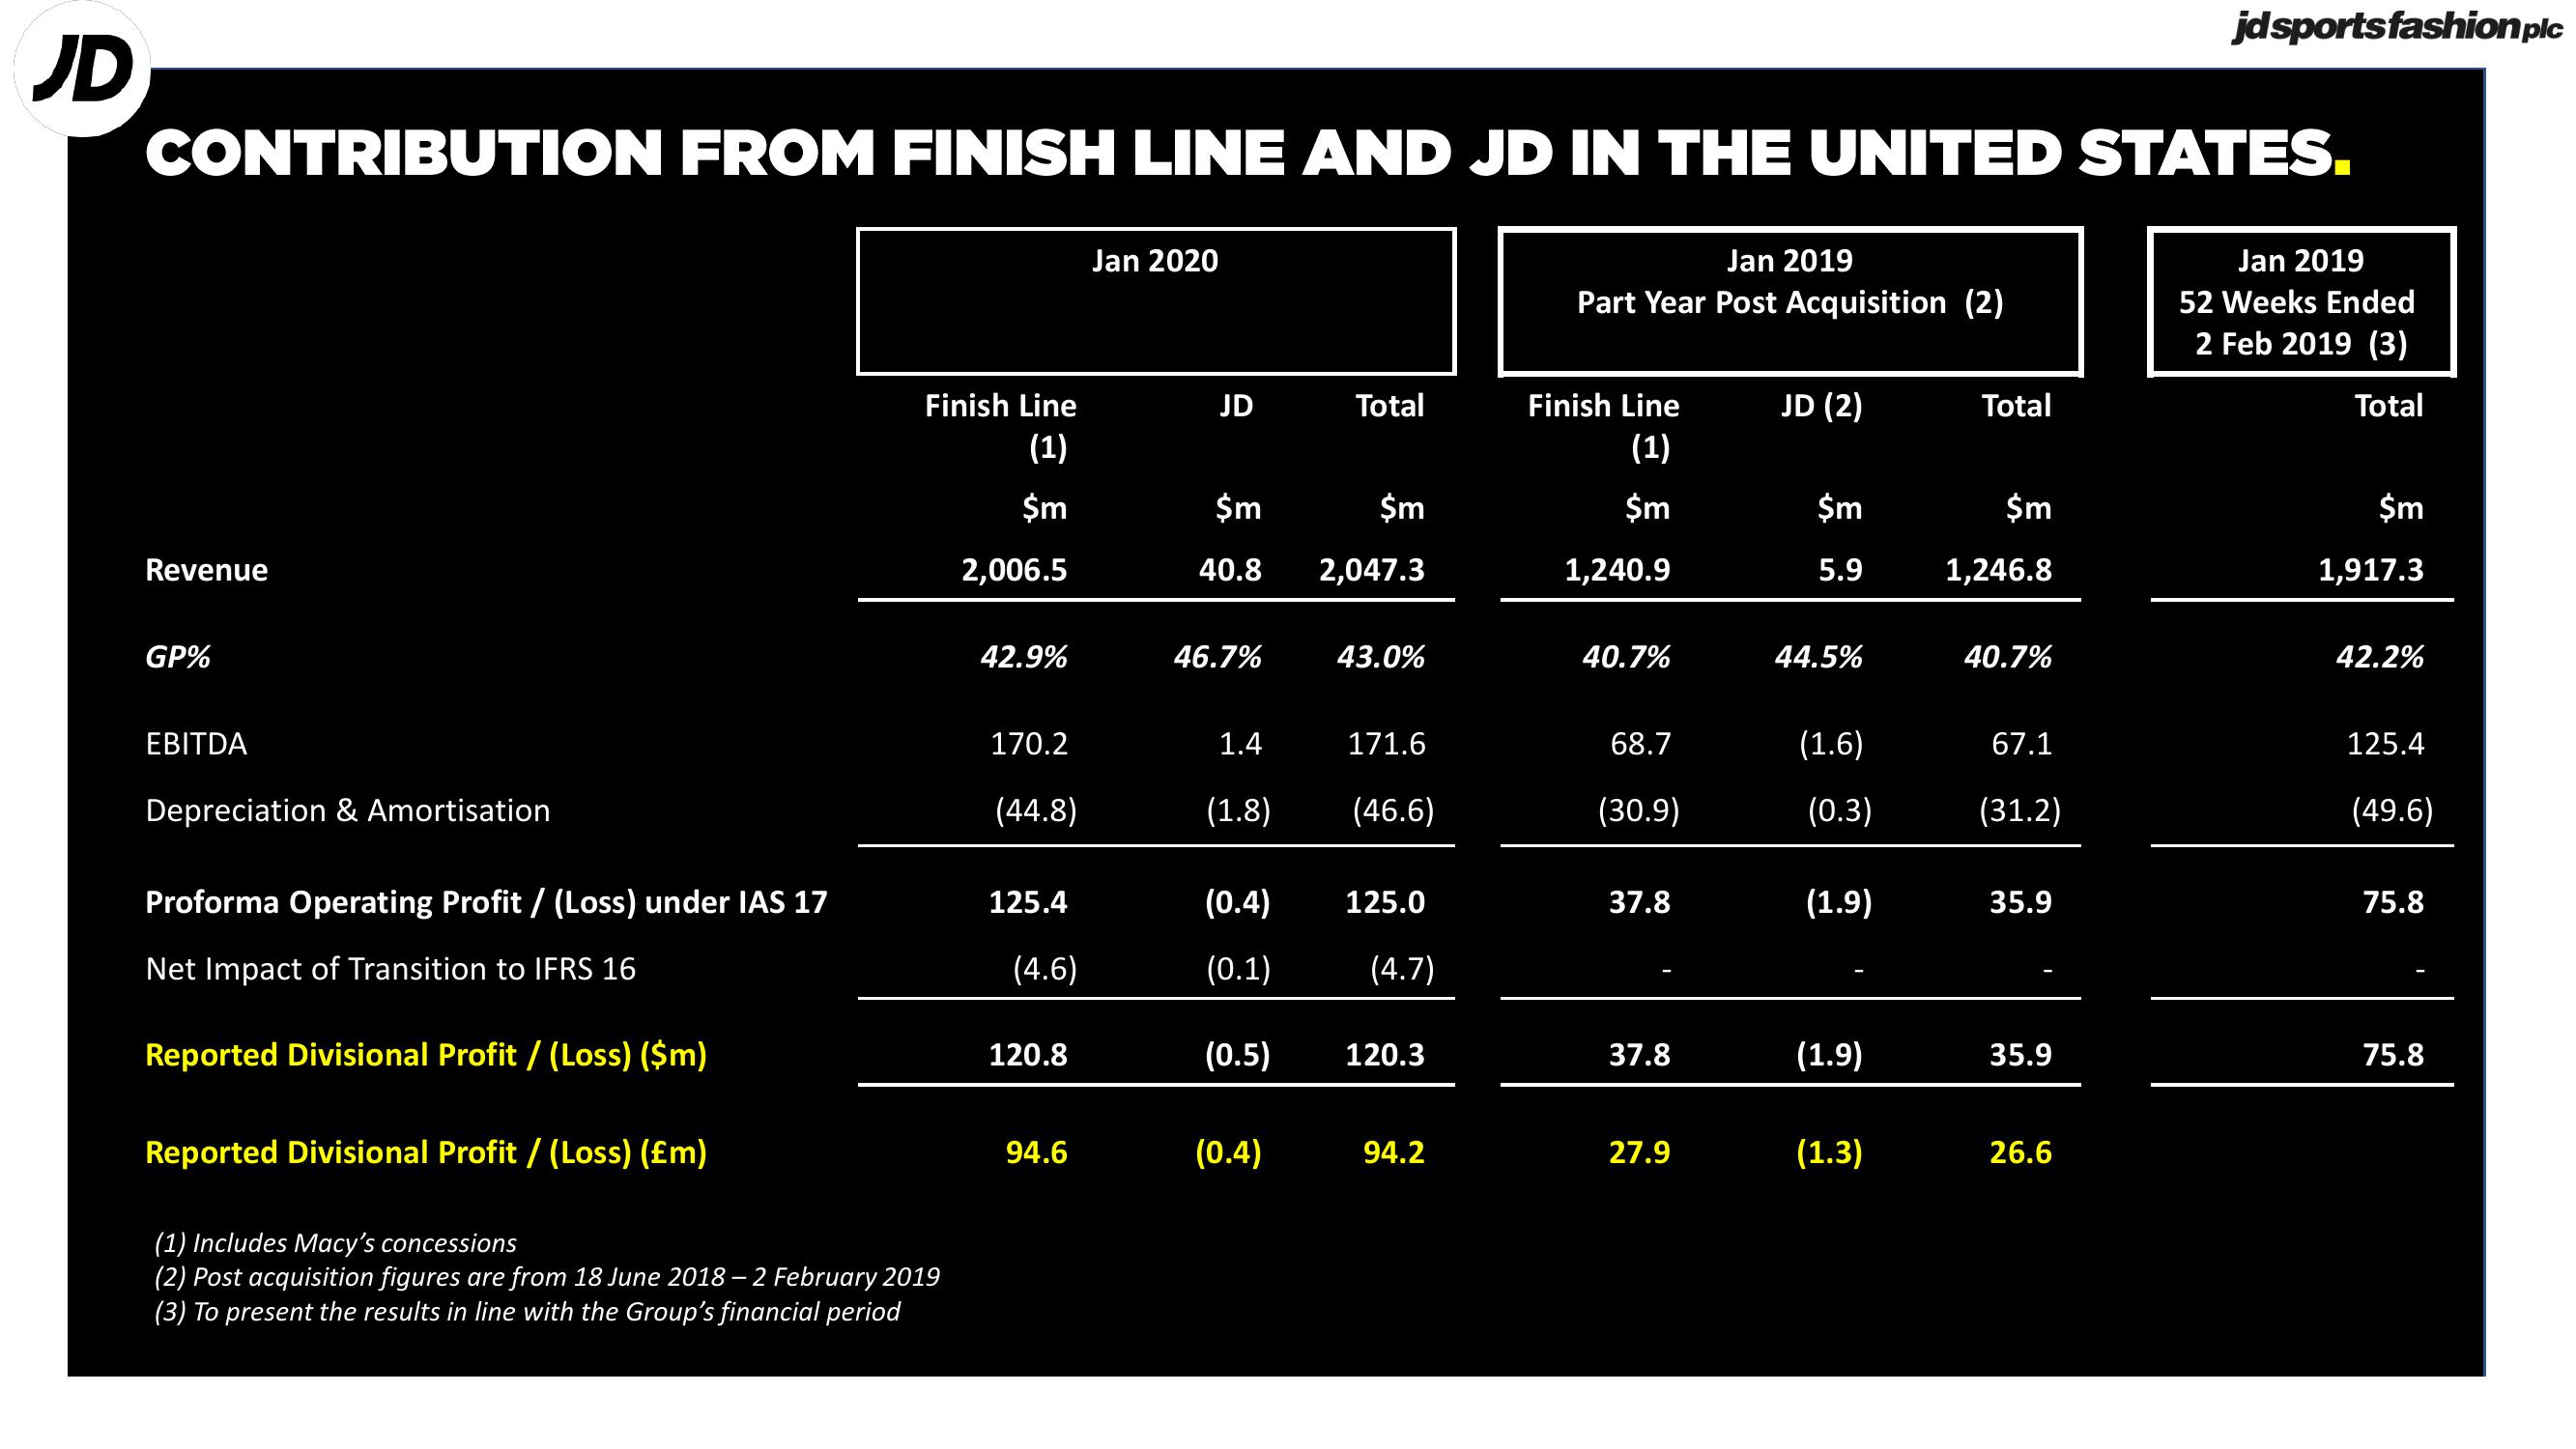
CONTRIBUTION FROM FINISH LINE AND JD IN THE UNITED STATES.
Revenue
GP%
EBITDA
Depreciation & Amortisation
Proforma Operating Profit / (Loss) under IAS 17
Net Impact of Transition to IFRS 16
Reported Divisional Profit/ (Loss) ($m)
Reported Divisional Profit / (Loss) (£m)
Finish Line
(1)
$m
2,006.5
(1) Includes Macy's concessions
(2) Post acquisition figures are from 18 June 2018-2 February 2019
(3) To present the results in line with the Group's financial period
42.9%
170.2
(44.8)
125.4
(4.6)
120.8
94.6
Jan 2020
JD
$m
$m
40.8 2,047.3
46.7%
1.4
(1.8)
Total
43.0%
(0.4)
171.6
(46.6)
(0.4) 125.0
(0.1)
(4.7)
(0.5) 120.3
94.2
Jan 2019
Part Year Post Acquisition (2)
Finish Line
(1)
$m
1,240.9
40.7%
68.7
(30.9)
37.8
37.8
27.9
JD (2)
$m
5.9
44.5%
(1.6)
(0.3)
(1.9)
(1.9)
(1.3)
Total
$m
1,246.8
40.7%
67.1
(31.2)
35.9
35.9
jd sports fashion plc
26.6
Jan 2019
52 Weeks Ended
2 Feb 2019 (3)
Total
$m
1,917.3
42.2%
125.4
(49.6)
75.8
75.8View entire presentation