Crocs Results Presentation Deck
Financial Outlook
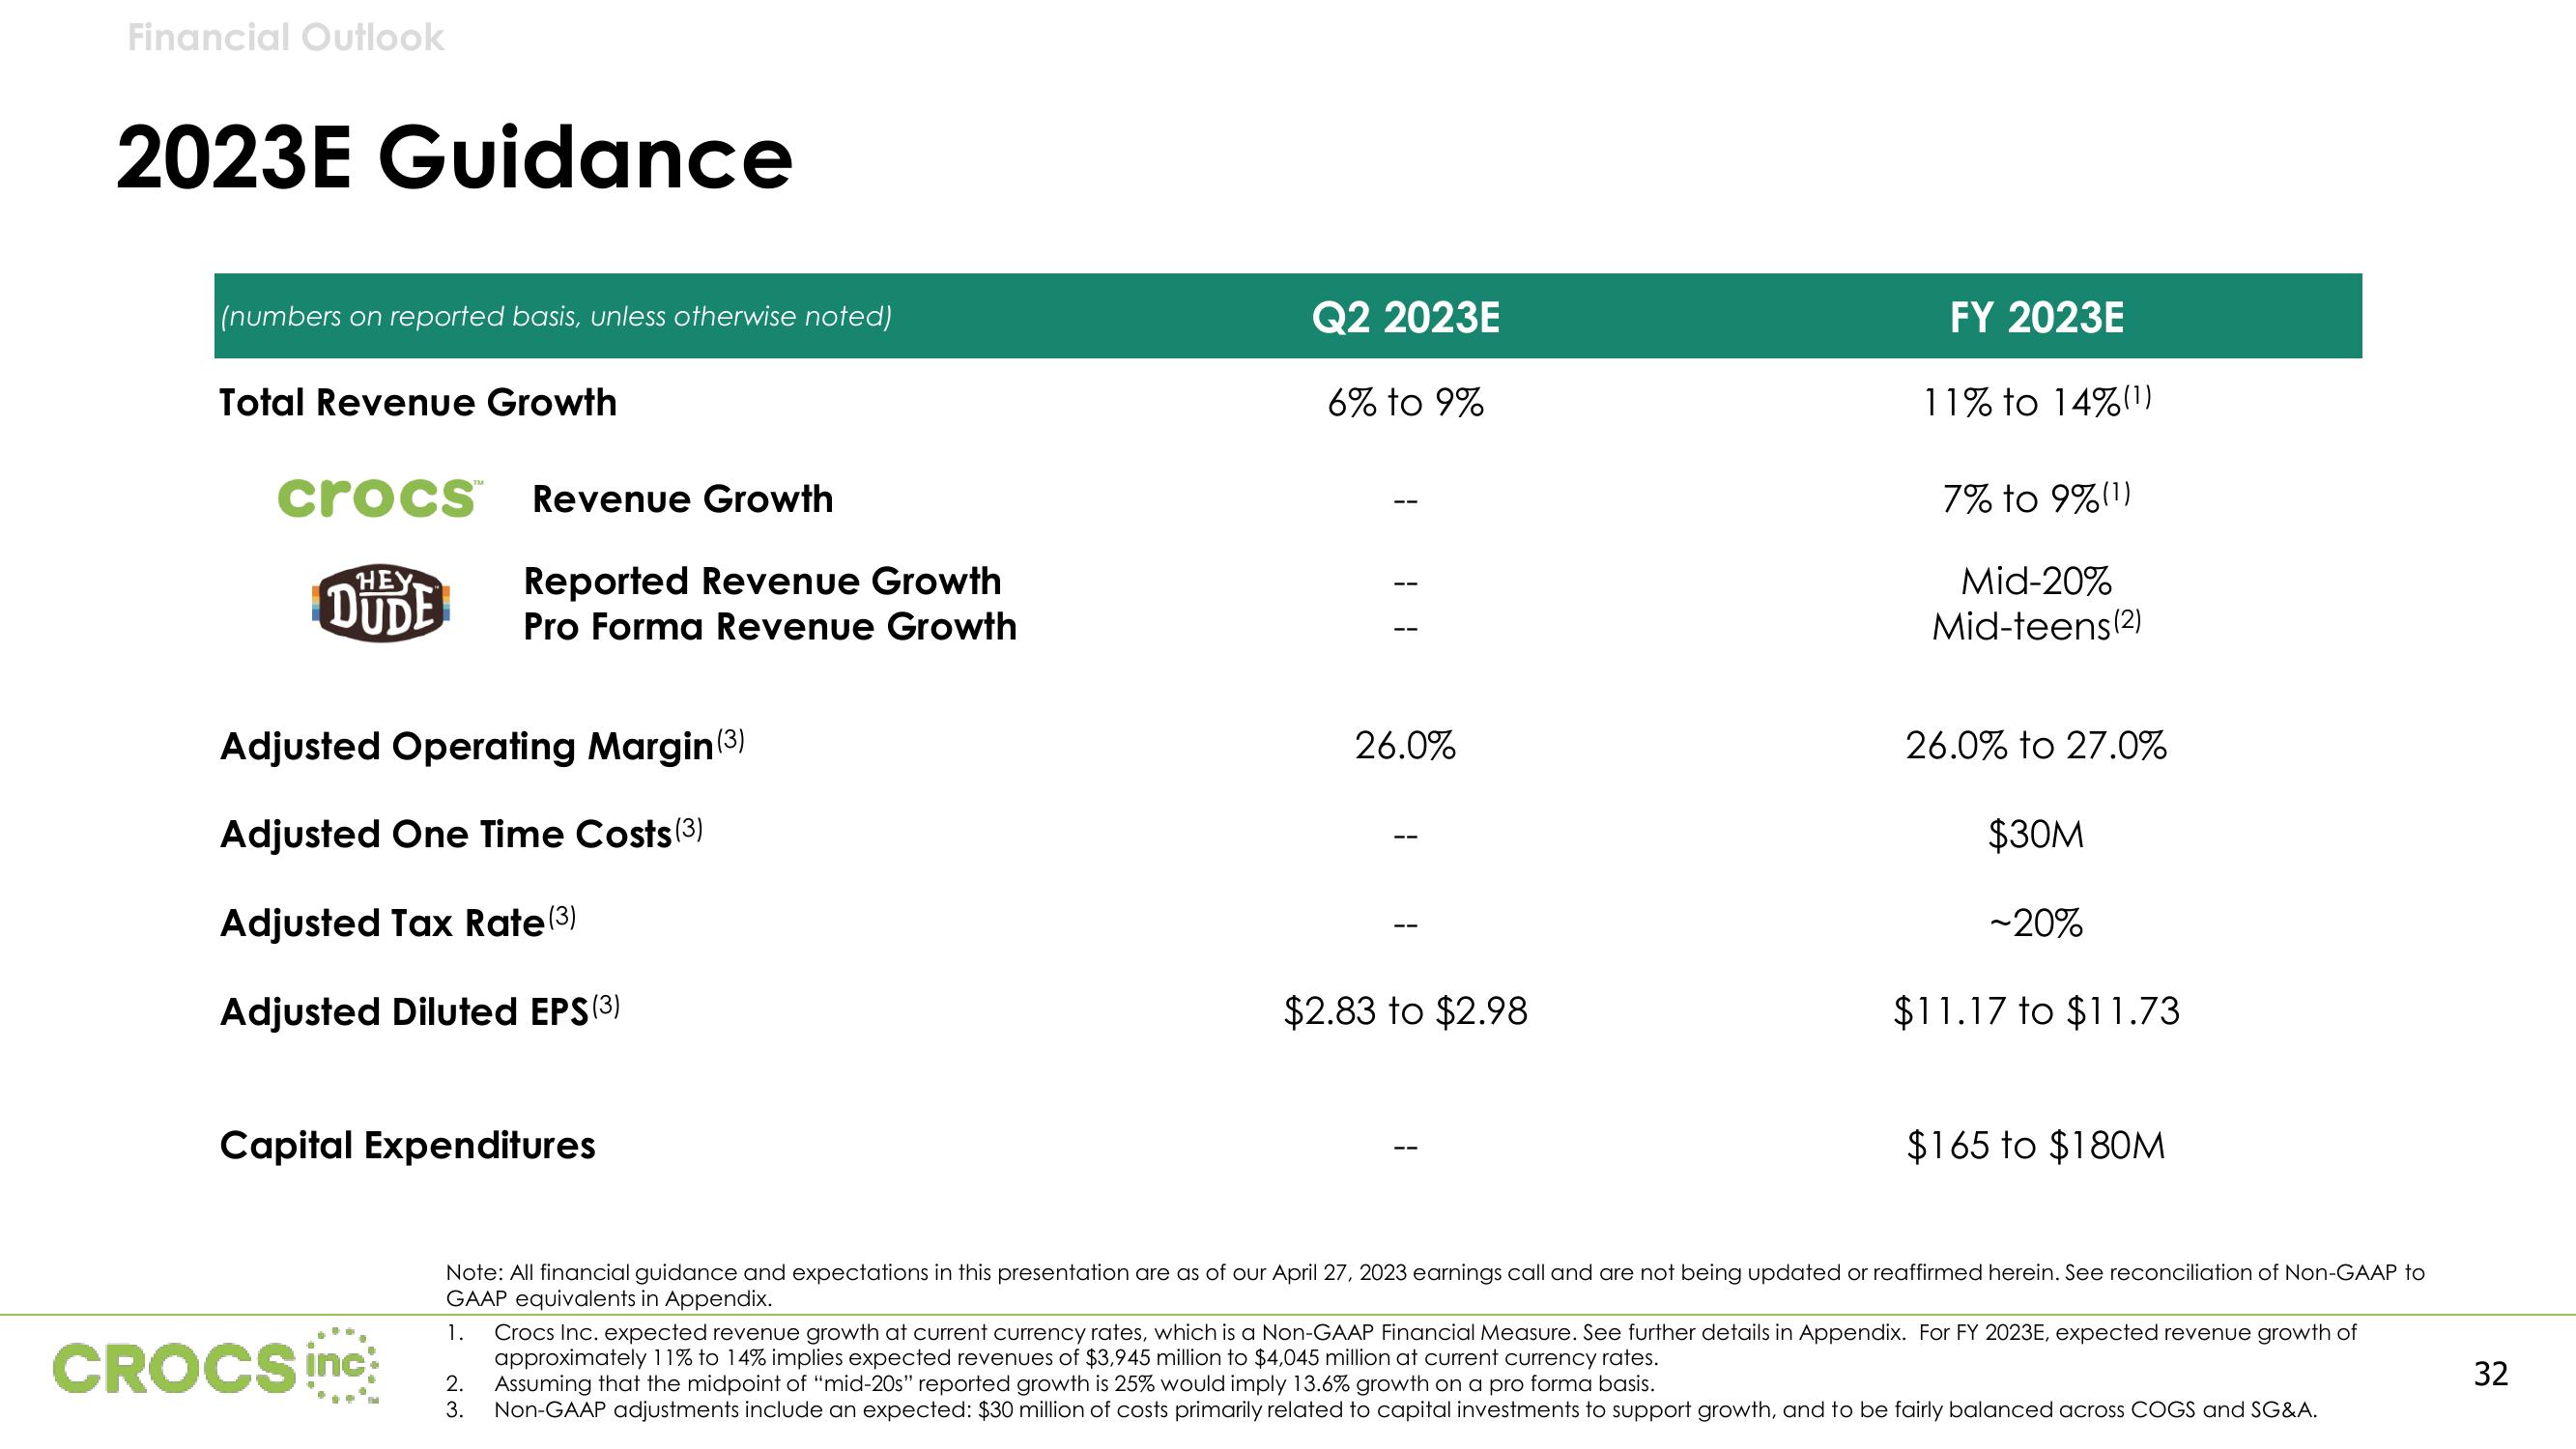
2023E Guidance
(numbers on reported basis, unless otherwise noted)
Total Revenue Growth
crocs™ Revenue Growth
HEY
DUDE
Reported Revenue Growth
Pro Forma Revenue Growth
Adjusted Operating Margin (3)
Adjusted One Time Costs (³)
Adjusted Tax Rate (³)
Adjusted Diluted EPS (3)
Capital Expenditures
CROCS inc
Q2 2023E
6% to 9%
1 1 1
26.0%
$2.83 to $2.98
FY 2023E
11% to 14% (1)
7% to 9% (1)
Mid-20%
Mid-teens(2)
26.0% to 27.0%
$30M
~20%
$11.17 to $11.73
$165 to $180M
Note: All financial guidance and expectations in this presentation are as of our April 27, 2023 earnings call and are not being updated or reaffirmed herein. See reconciliation of Non-GAAP to
GAAP equivalents in Appendix.
1. Crocs Inc. expected revenue growth at current currency rates, which is a Non-GAAP Financial Measure. See further details in Appendix. For FY 2023E, expected revenue growth of
approximately 11% to 14% implies expected revenues of $3,945 million to $4,045 million at current currency rates.
2. Assuming that the midpoint of "mid-20s" reported growth is 25% would imply 13.6% growth on a pro forma basis.
3.
Non-GAAP adjustments include an expected: $30 million of costs primarily related to capital investments to support growth, and to be fairly balanced across COGS and SG&A.
32View entire presentation