Maersk Results Presentation Deck
A.P. Moller Maersk Group
- Interim Report 02 2015
APM
TERMINALS
Contents
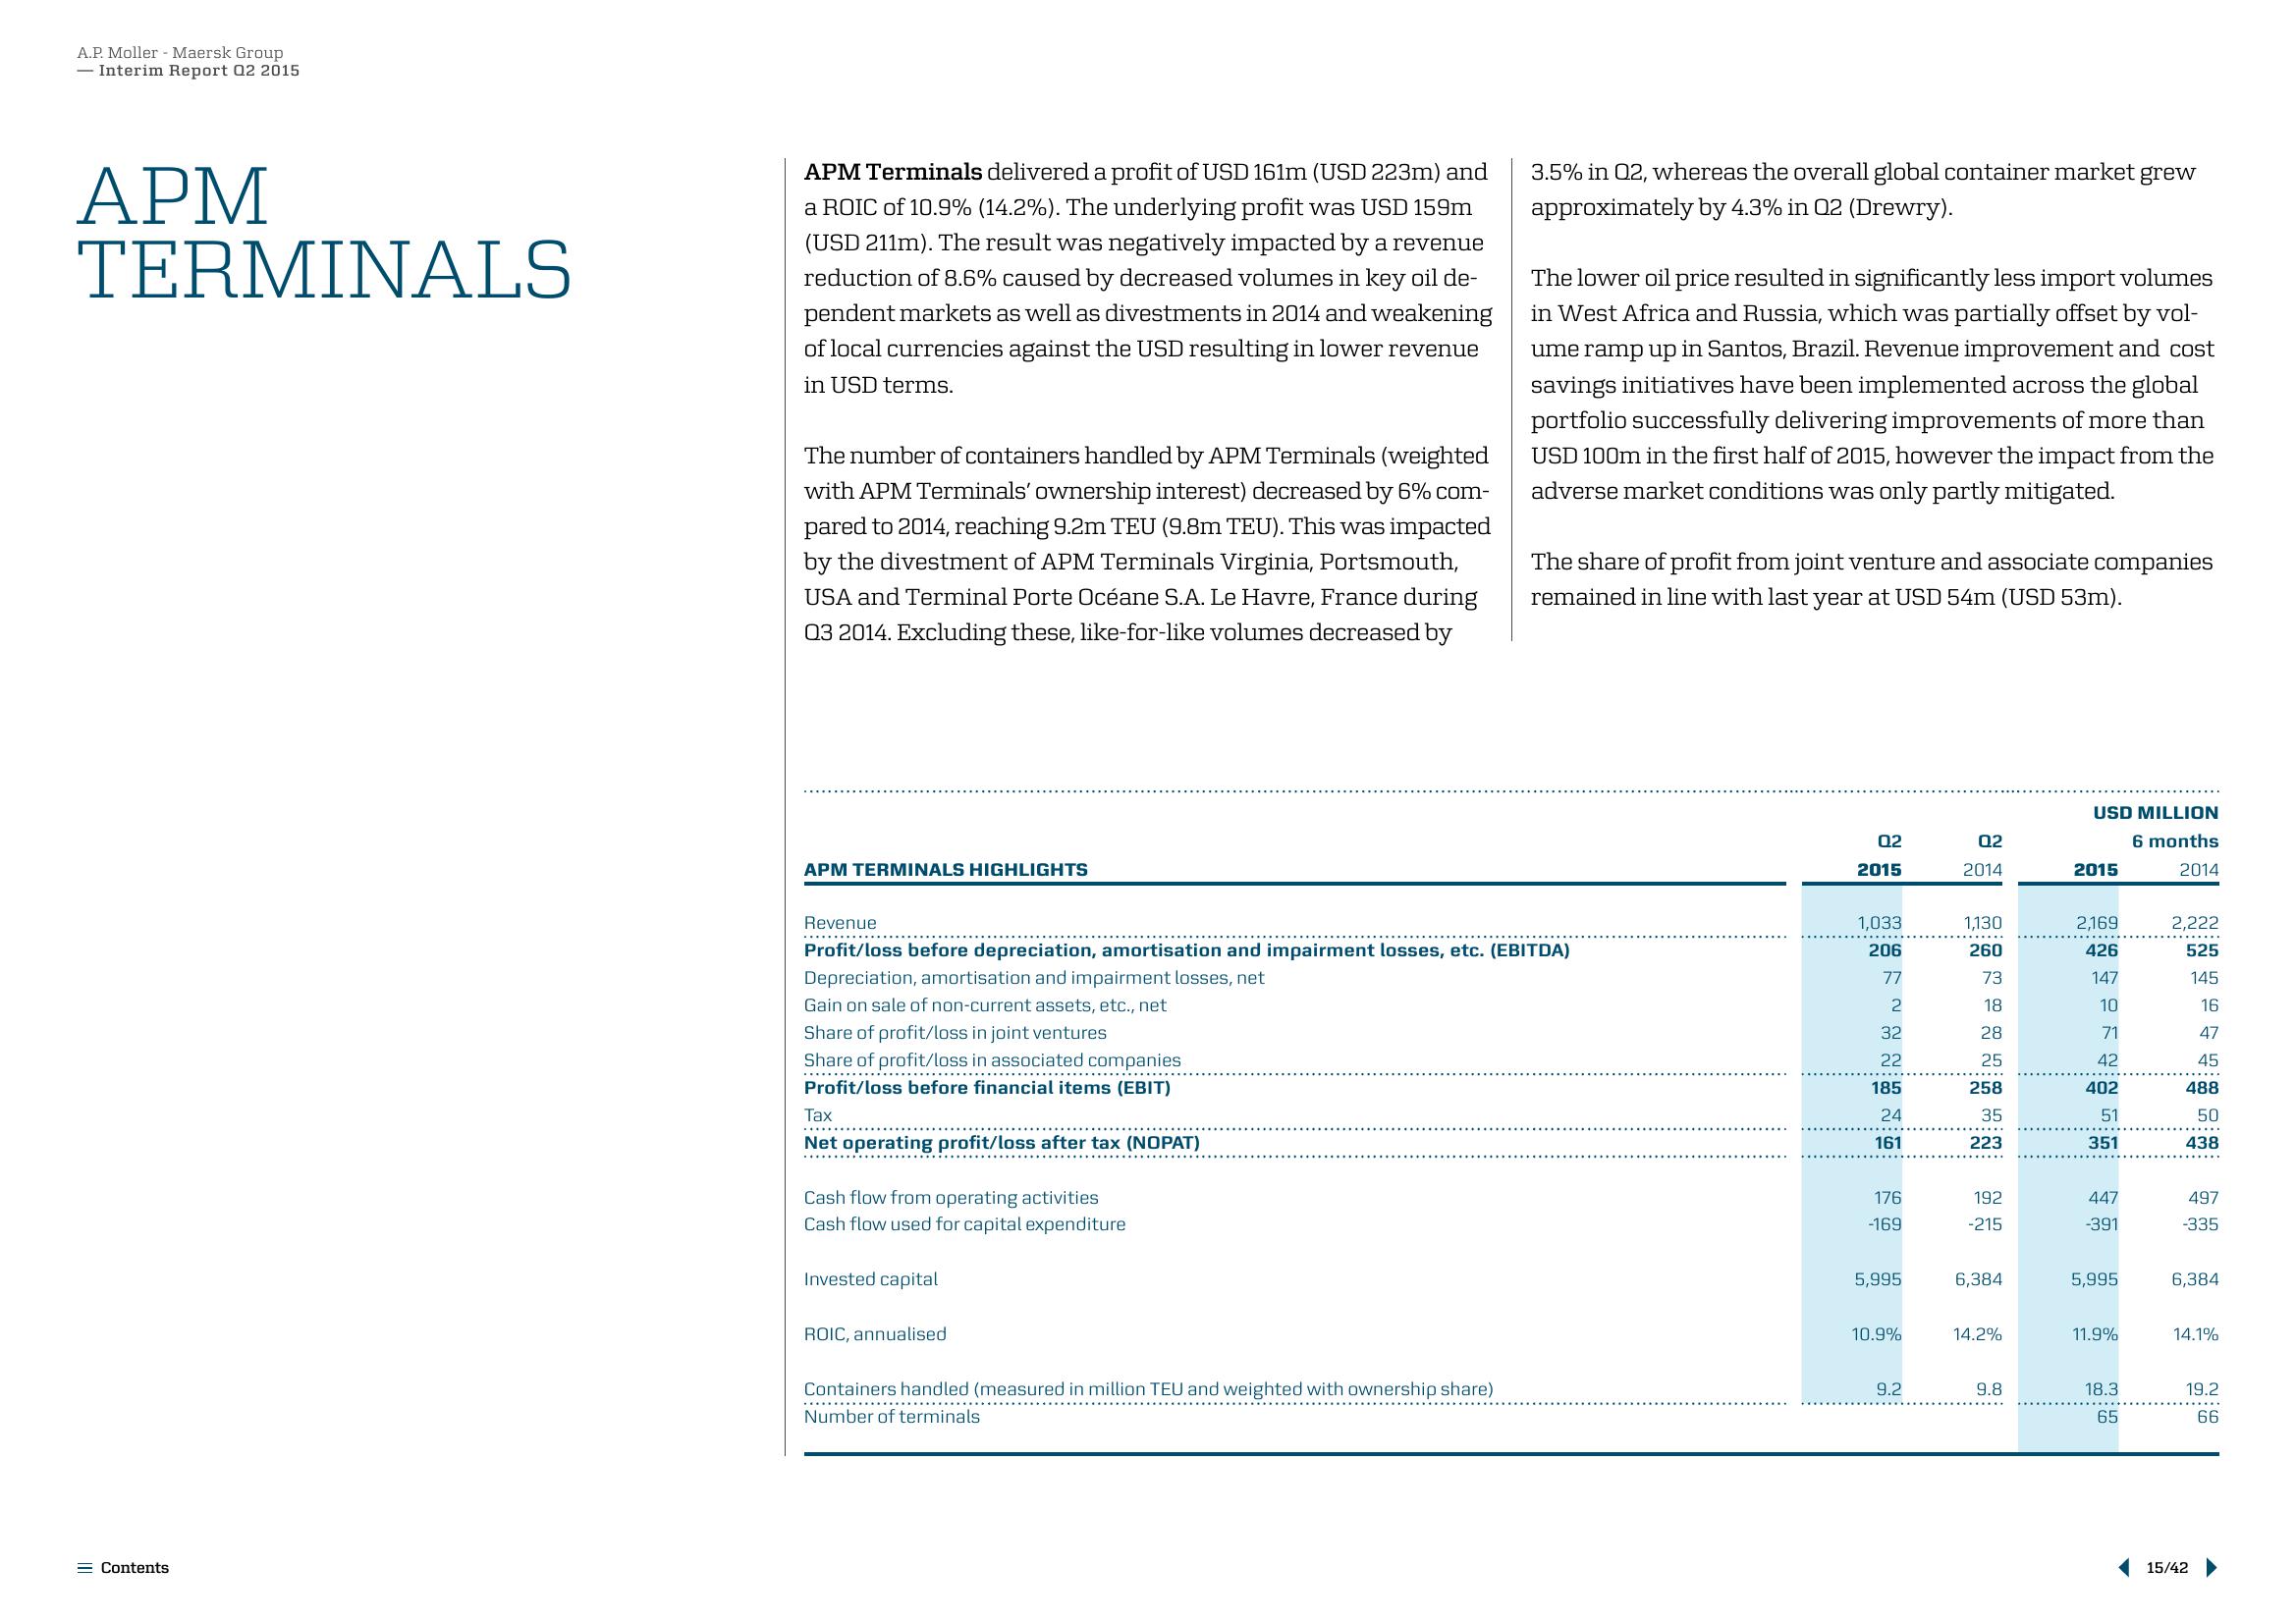
APM Terminals delivered a profit of USD 161m (USD 223m) and
a ROIC of 10.9% (14.2%). The underlying profit was USD 159m
(USD 211m). The result was negatively impacted by a revenue
reduction of 8.6% caused by decreased volumes in key oil de-
pendent markets as well as divestments in 2014 and weakening
of local currencies against the USD resulting in lower revenue
in USD terms.
The number of containers handled by APM Terminals (weighted
with APM Terminals' ownership interest) decreased by 6% com-
pared to 2014, reaching 9.2m TEU (9.8m TEU). This was impacted
by the divestment of APM Terminals Virginia, Portsmouth,
USA and Terminal Porte Océane S.A. Le Havre, France during
03 2014. Excluding these, like-for-like volumes decreased by
APM TERMINALS HIGHLIGHTS
..............
Tax
Net operating profit/loss after tax (NOPAT)
Revenue
Profit/loss before depreciation, amortisation and impairment losses, etc. (EBITDA)
Depreciation, amortisation and impairment losses, net
Gain on sale of non-current assets, etc., net
Share of profit/loss in joint ventures
Share of profit/loss in associated companies
Profit/loss before financial items (EBIT)
Cash flow from operating activities
Cash flow used for capital expenditure
Invested capital
ROIC, annualised
3.5% in Q2, whereas the overall global container market grew
approximately by 4.3% in 02 (Drewry).
Containers handled (measured in million TEU and weighted with ownership share)
Number of terminals
The lower oil price resulted in significantly less import volumes
in West Africa and Russia, which was partially offset by vol-
ume ramp up in Santos, Brazil. Revenue improvement and cost
savings initiatives have been implemented across the global
portfolio successfully delivering improvements of more than
USD 100m in the first half of 2015, however the impact from the
adverse market conditions was only partly mitigated.
The share of profit from joint venture and associate companies
remained in line with last year at USD 54m (USD 53m).
02
2015
1,033
206
77
2
32
22
185
24
161
176
-169
5,995
10.9%
9.2
02
2014
1,130
260
73
18
28
25
258
35
223
192
-215
6,384
14.2%
9.8
USD MILLION
6 months
2014
2015
2,169
426
147
10
71
42
402
51
351
447
-391
5,995
11.9%
18.3
65
2,222
525
145
16
47
45
488
50
438
497
-335
6,384
14.1%
19.2
66
15/42View entire presentation