Kering Investor Presentation Deck slide image

Kering Investor Presentation Deck

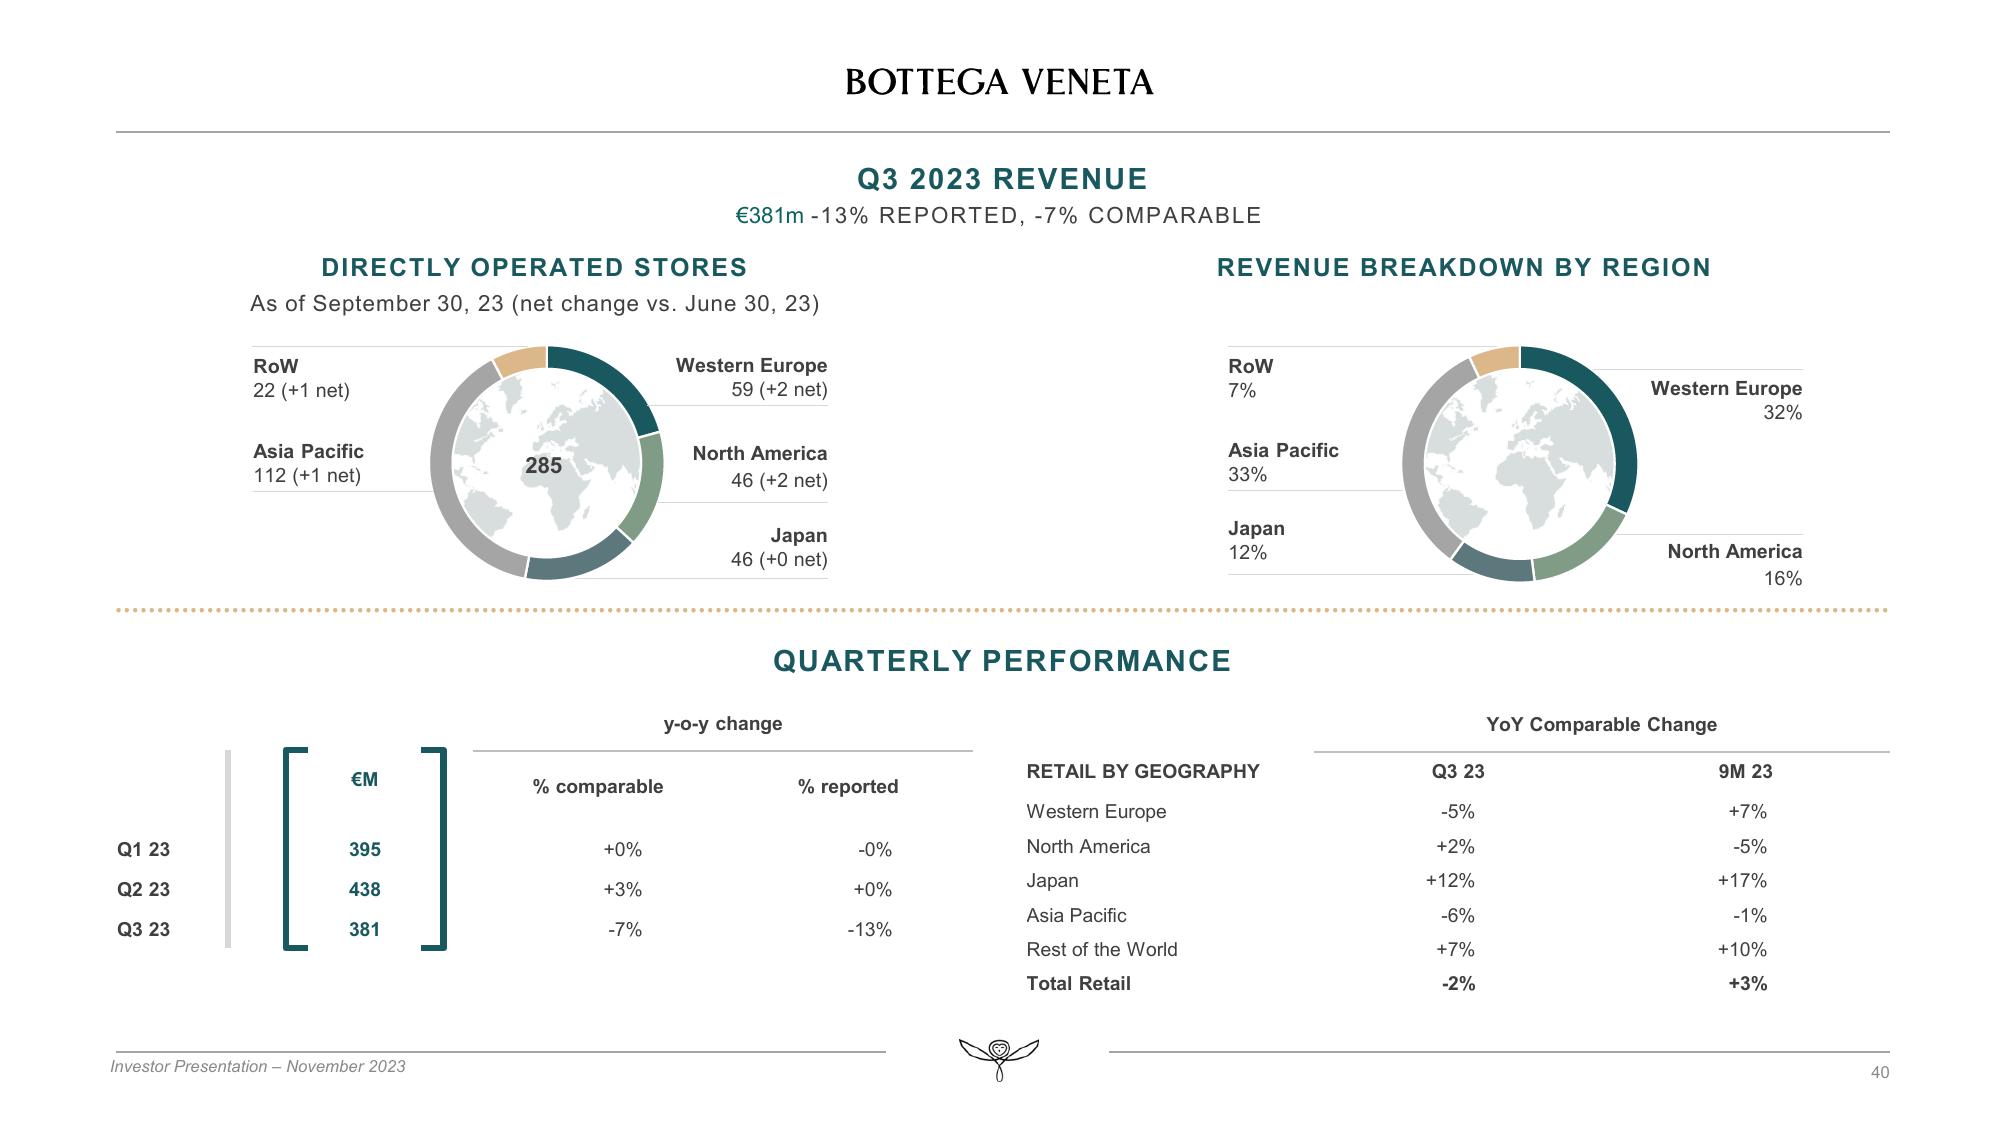
Q1 23 Q2 23 Q3 23 DIRECTLY OPERATED STORES As of September 30, 23 (net change vs. June 30, 23) ROW 22 (+1 net) Asia Pacific 112 (+1 net) €M [G] 395 438 381 Investor Presentation - November 2023 285 % comparable +0% +3% -7% Q3 2023 REVENUE €381m -13% REPORTED, -7% COMPARABLE Western Europe 59 (+2 net) North America 46 (+2 net) Japan 46 (+0 net) BOTTEGA VENETA y-o-y change % reported REVENUE BREAKDOWN BY REGION -0% +0% -13% ROW 7% QUARTERLY PERFORMANCE Asia Pacific 33% Japan 12% RETAIL BY GEOGRAPHY Western Europe North America Japan Asia Pacific Rest of the World Total Retail Q3 23 -5% +2% +12% -6% +7% -2% Western Europe 32% North America 16% YoY Comparable Change 9M 23 +7% -5% +17% -1% +10% +3% 40
View entire presentation