GlobalFoundries Results Presentation Deck
Key 2021 Results
(Unaudited)
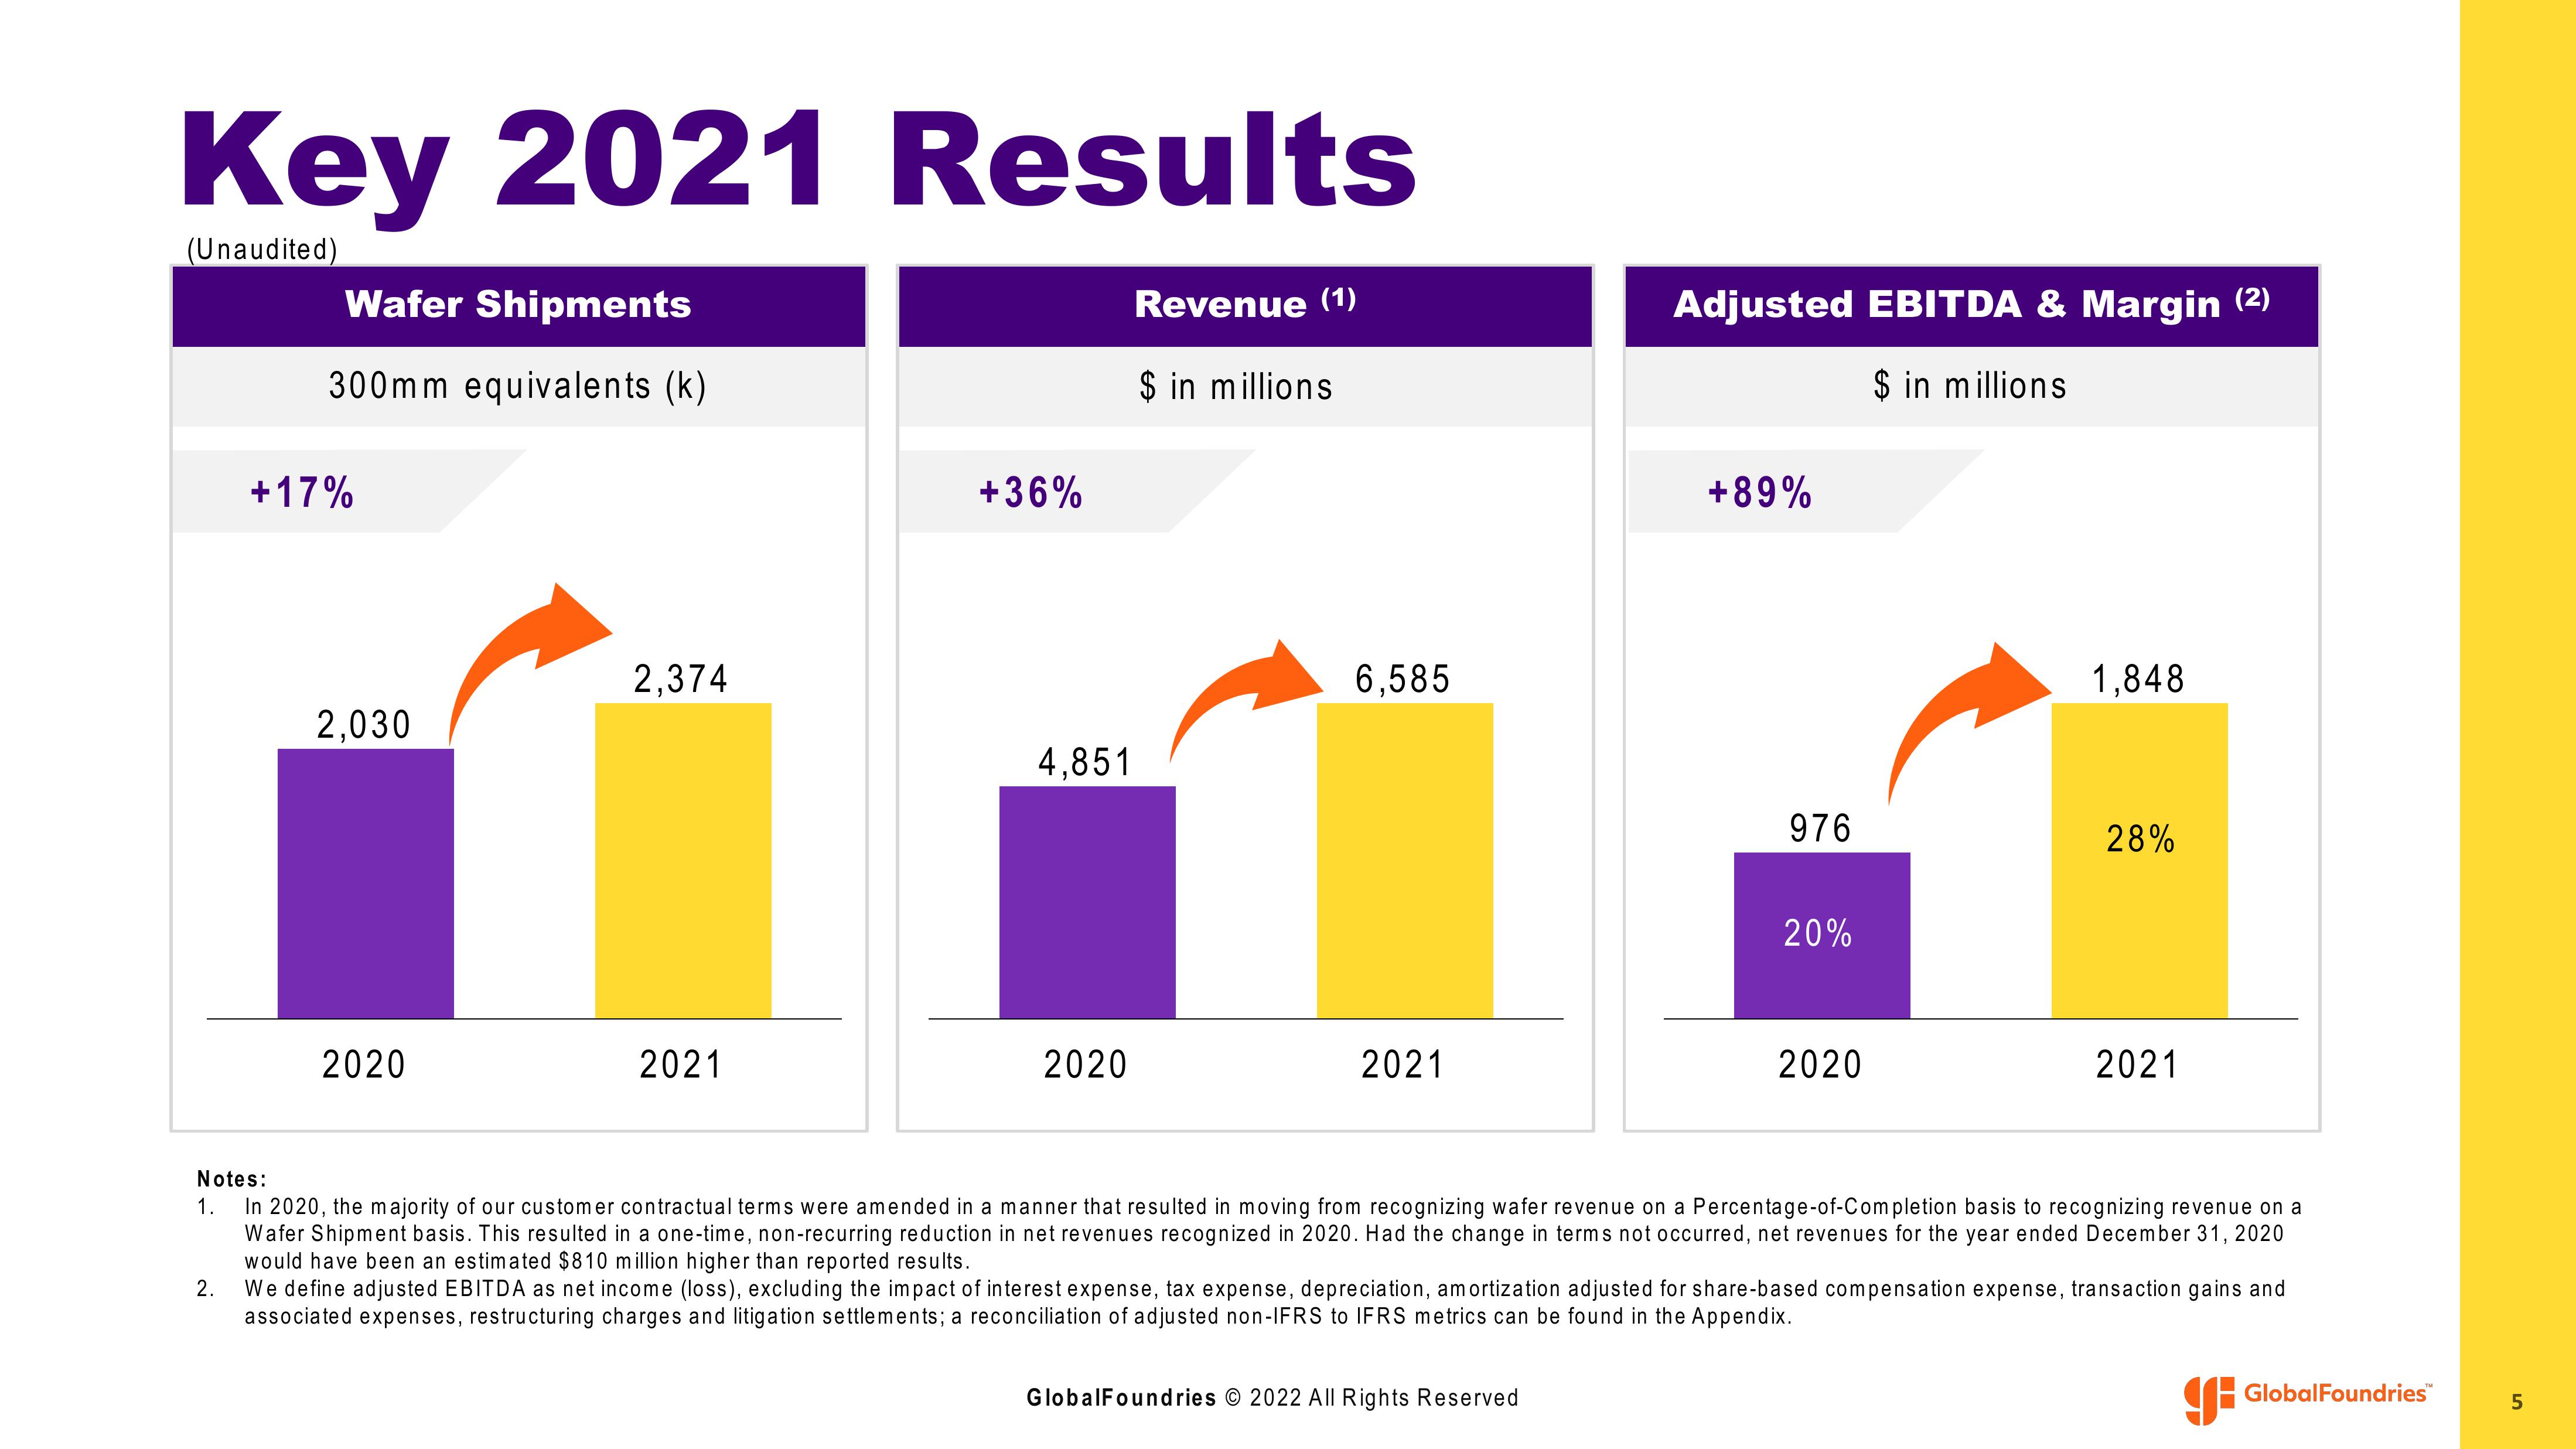
Wafer Shipments
300mm equivalents (k)
2.
+17%
2,030
2020
2,374
2021
+36%
4,851
2020
Revenue (1)
$ in millions
6,585
2021
Adjusted EBITDA & Margin (2)
$ in millions
+89%
GlobalFoundries © 2022 All Rights Reserved
976
20%
2020
1,848
28%
Notes:
1. In 2020, the majority of our customer contractual terms were amended in a manner that resulted in moving from recognizing wafer revenue on a Percentage-of-Completion basis to recognizing revenue on a
Wafer Shipment basis. This resulted in a one-time, non-recurring reduction in net revenues recognized in 2020. Had the change in terms not occurred, net revenues for the year ended December 31, 2020
would have been an estimated $810 million higher than reported results.
2021
We define adjusted EBITDA as net income (loss), excluding the impact of interest expense, tax expense, depreciation, amortization adjusted for share-based compensation expense, transaction gains and
associated expenses, restructuring charges and litigation settlements; a reconciliation of adjusted non-IFRS to IFRS metrics can be found in the Appendix.
GlobalFoundries
5View entire presentation