Uber Results Presentation Deck
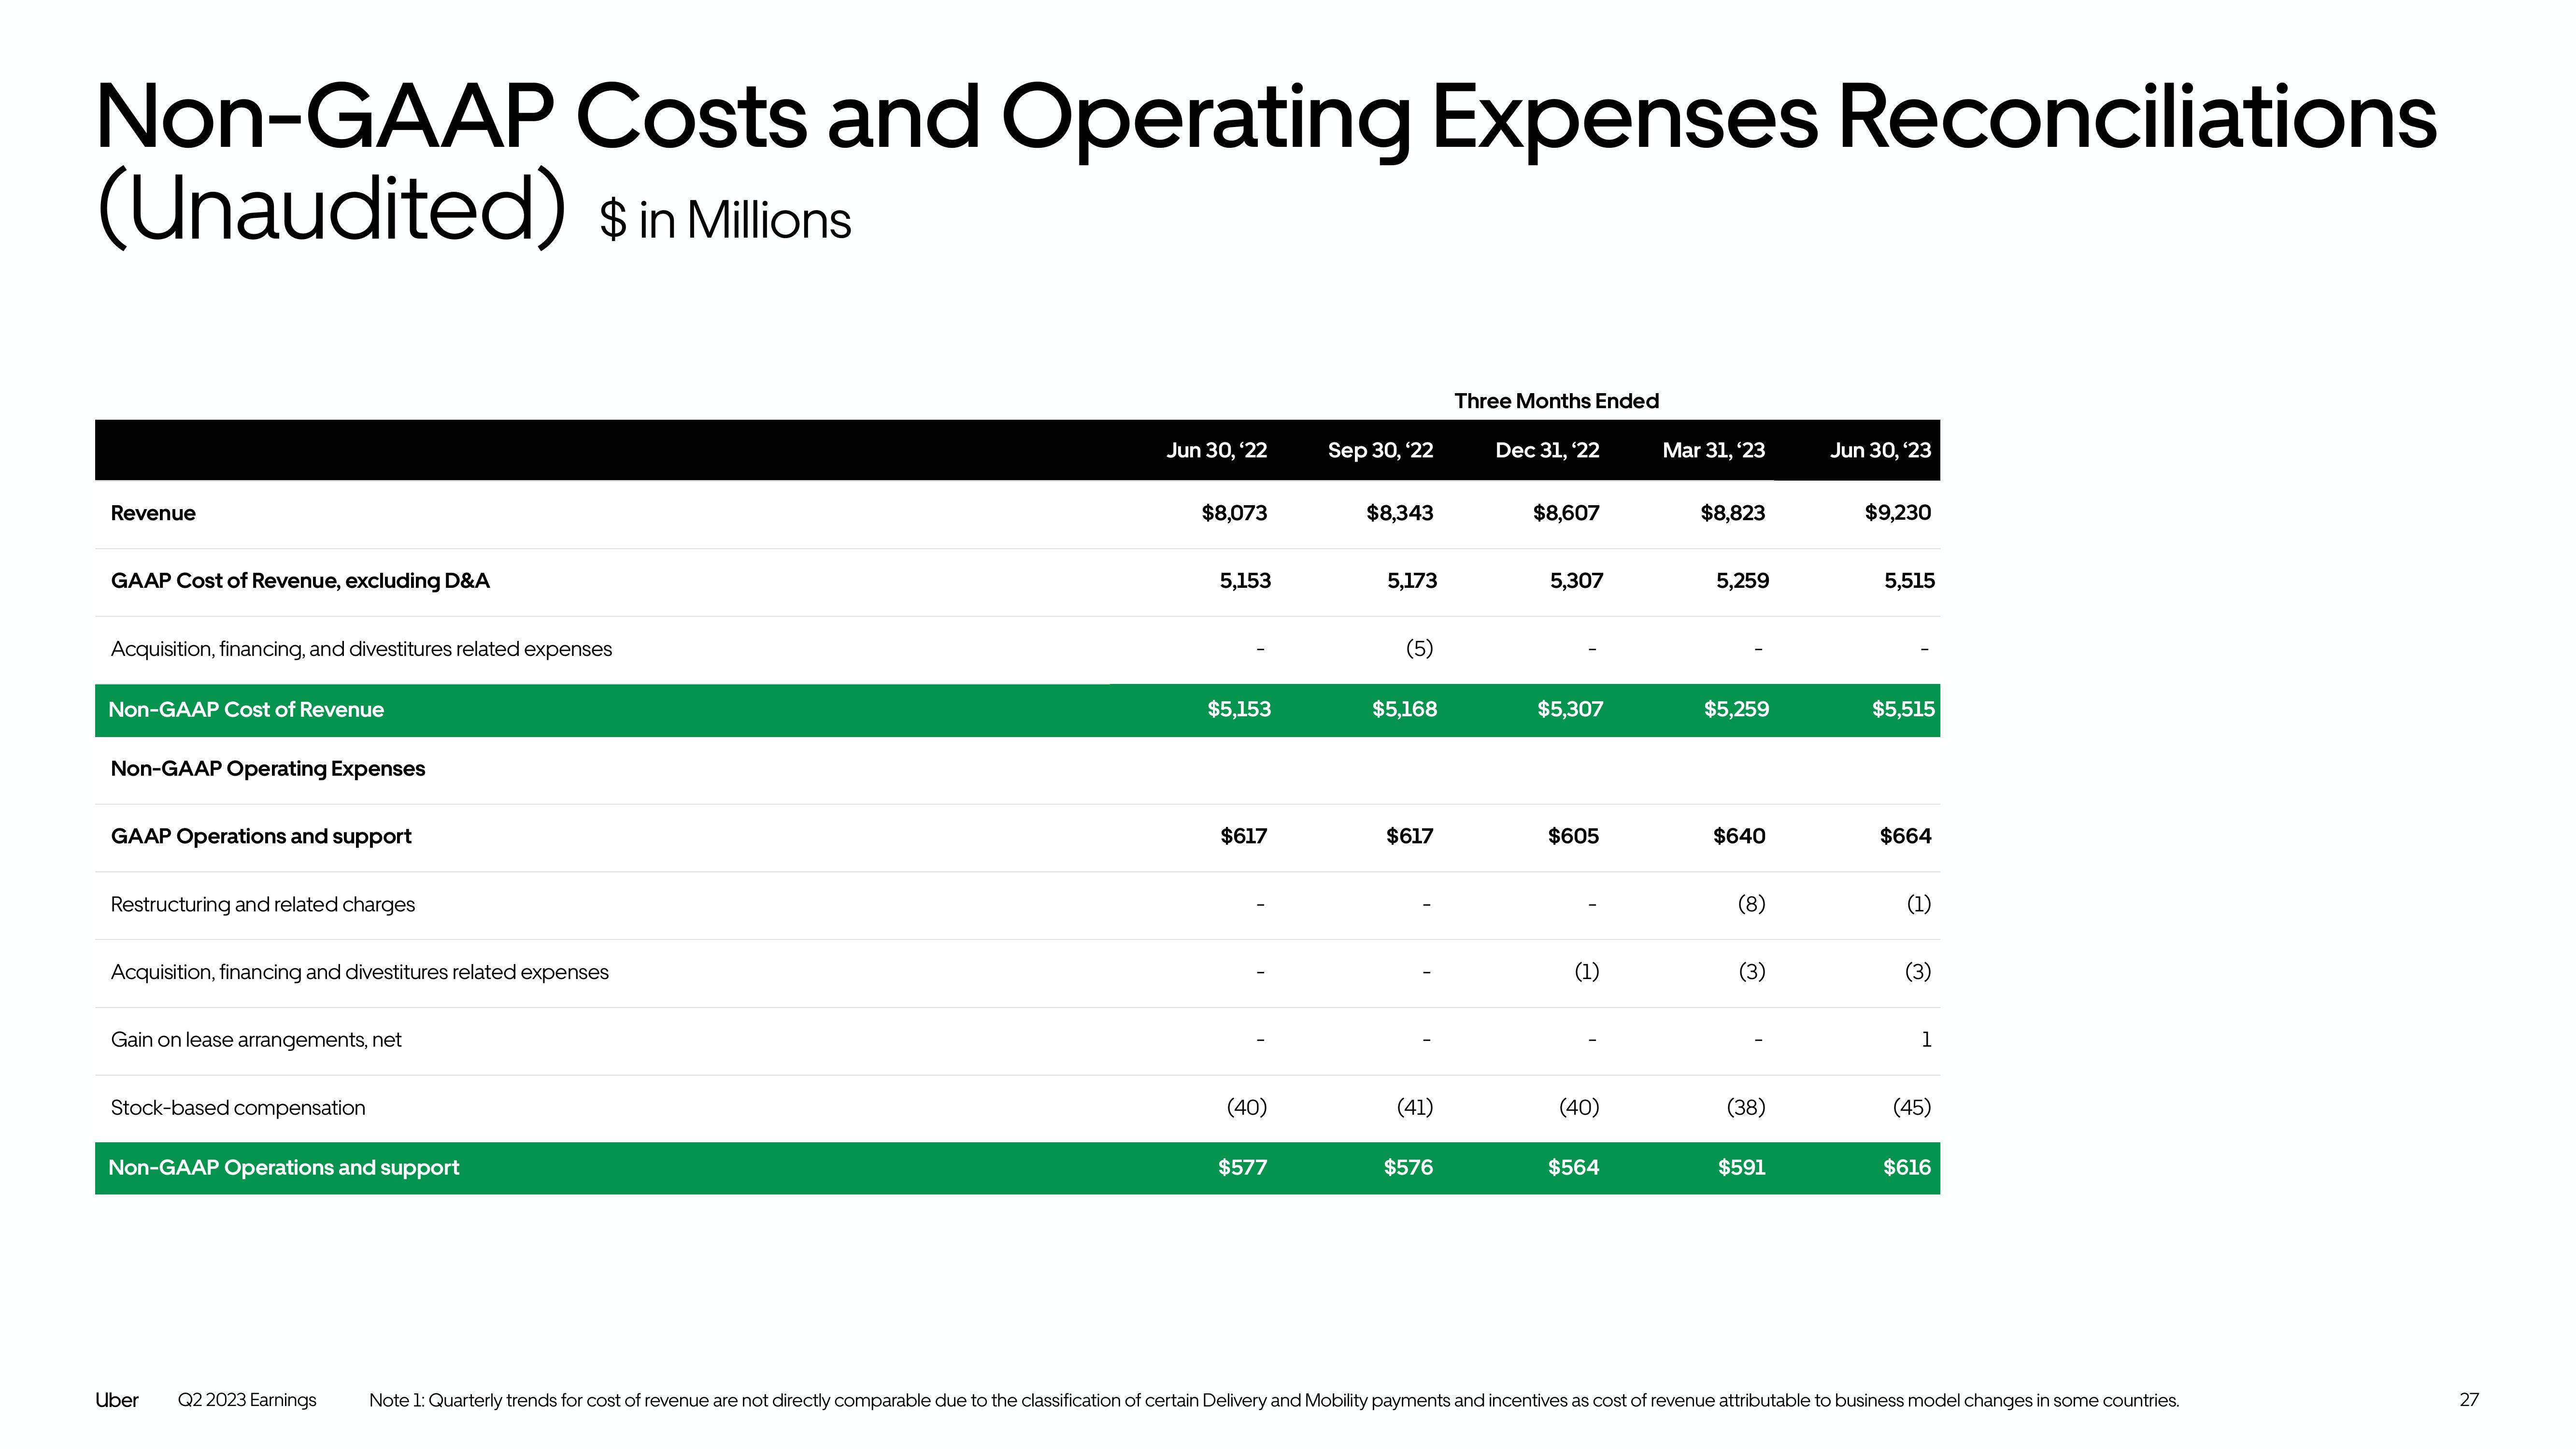
Non-GAAP Costs and Operating Expenses Reconciliations
(Unaudited) $ in Millions
Revenue
GAAP Cost of Revenue, excluding D&A
Acquisition, financing, and divestitures related expenses
Non-GAAP Cost of Revenue
Non-GAAP Operating Expenses
GAAP Operations and support
Restructuring and related charges
Acquisition, financing and divestitures related expenses
Gain on lease arrangements, net
Stock-based compensation
Non-GAAP Operations and support
Uber
Q2 2023 Earnings
Jun 30, '22
$8,073
5,153
$5,153
$617
(40)
$577
Sep 30, '22
$8,343
5,173
(5)
$5,168
$617
(41)
$576
Three Months Ended
Dec 31, '22
$8,607
5,307
$5,307
$605
(1)
I
(40)
$564
Mar 31, '23
$8,823
5,259
$5,259
$640
(8)
(3)
I
(38)
$591
Jun 30, '23
$9,230
5,515
$5,515
$664
(1)
(3)
1
(45)
$616
Note 1: Quarterly trends for cost of revenue are not directly comparable due to the classification of certain Delivery and Mobility payments and incentives as cost of revenue attributable to business model changes in some countries.
27View entire presentation