Hilltop Holdings Results Presentation Deck
PlainsCapital Bank - Q2 2023 Highlights
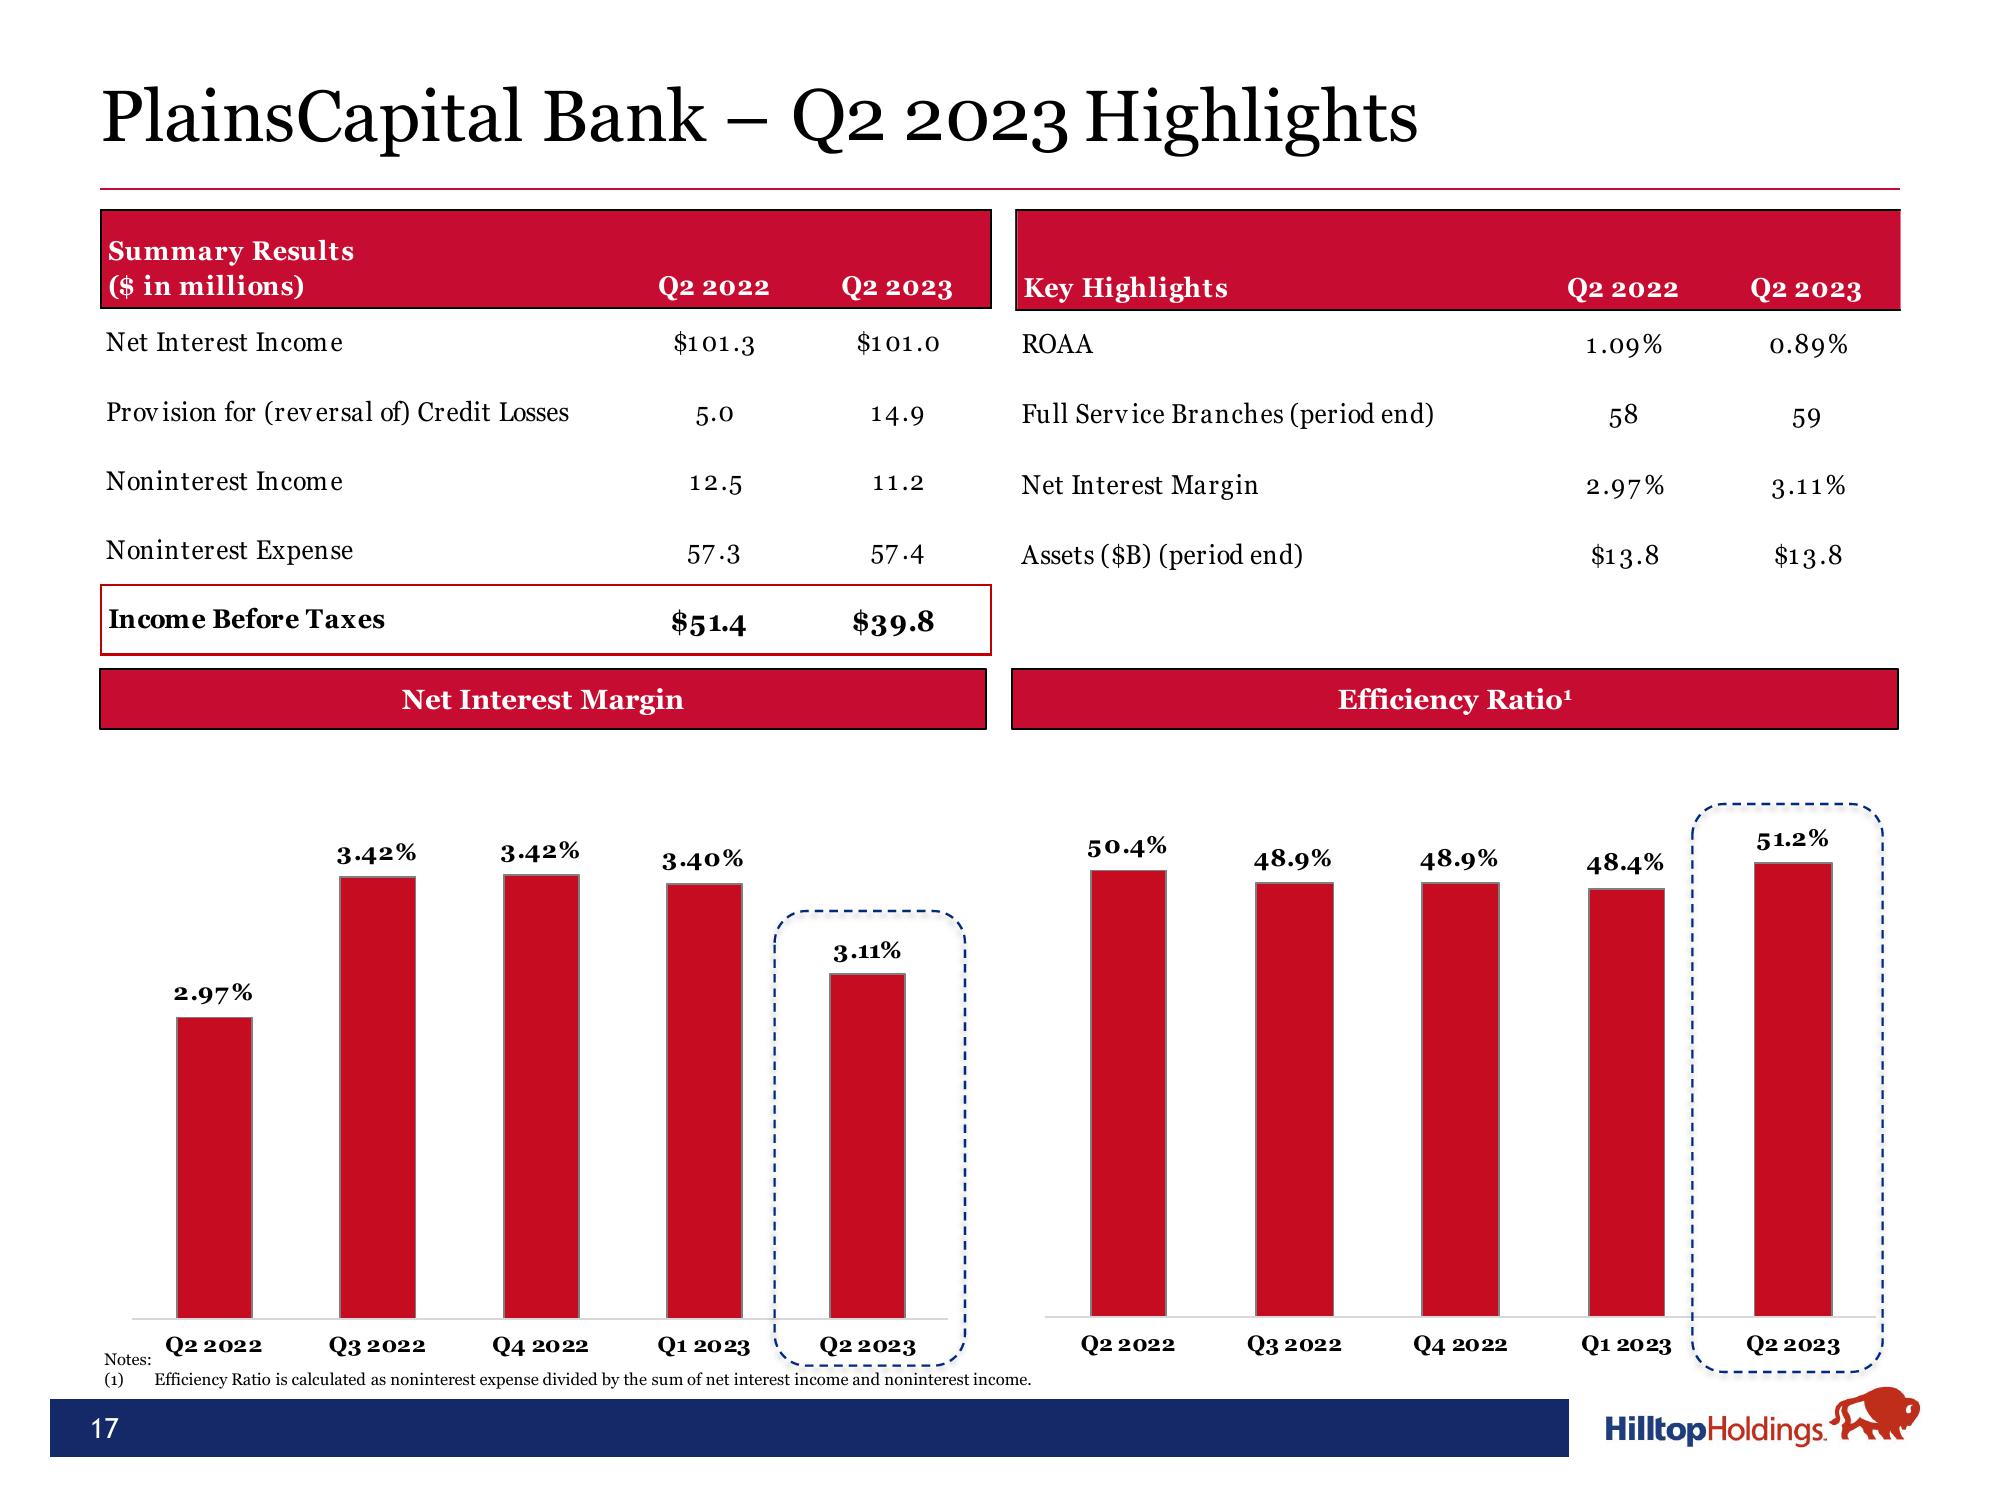
Summary Results
($ in millions)
Net Interest Income
Provision for (reversal of) Credit Losses
Noninterest Income
Noninterest Expense
Income Before Taxes
2.97%
3.42%
Q2 2022
$101.3
Net Interest Margin
3.42%
5.0
12.5
57.3
$51.4
3.40%
Q2 2023
$101.0
14.9
11.2
57.4
$39.8
3.11%
Key Highlights
ROAA
Full Service Branches (period end)
Net Interest Margin
Assets ($B) (period end)
Q2 2022
Q3 2022
Q4 2022
Q1 2023
Q2 2023
Notes:
(1) Efficiency Ratio is calculated as noninterest expense divided by the sum of net interest income and noninterest income.
17
50.4%
Q2 2022
48.9%
Efficiency Ratio¹
Q3 2022
48.9%
Q2 2022
1.09%
Q4 2022
58
2.97%
$13.8
48.4%
Q1 2023
Q2 2023
0.89%
59
3.11%
$13.8
51.2%
Q2 2023
Hilltop Holdings.View entire presentation