Membership Collective Group Results Presentation Deck
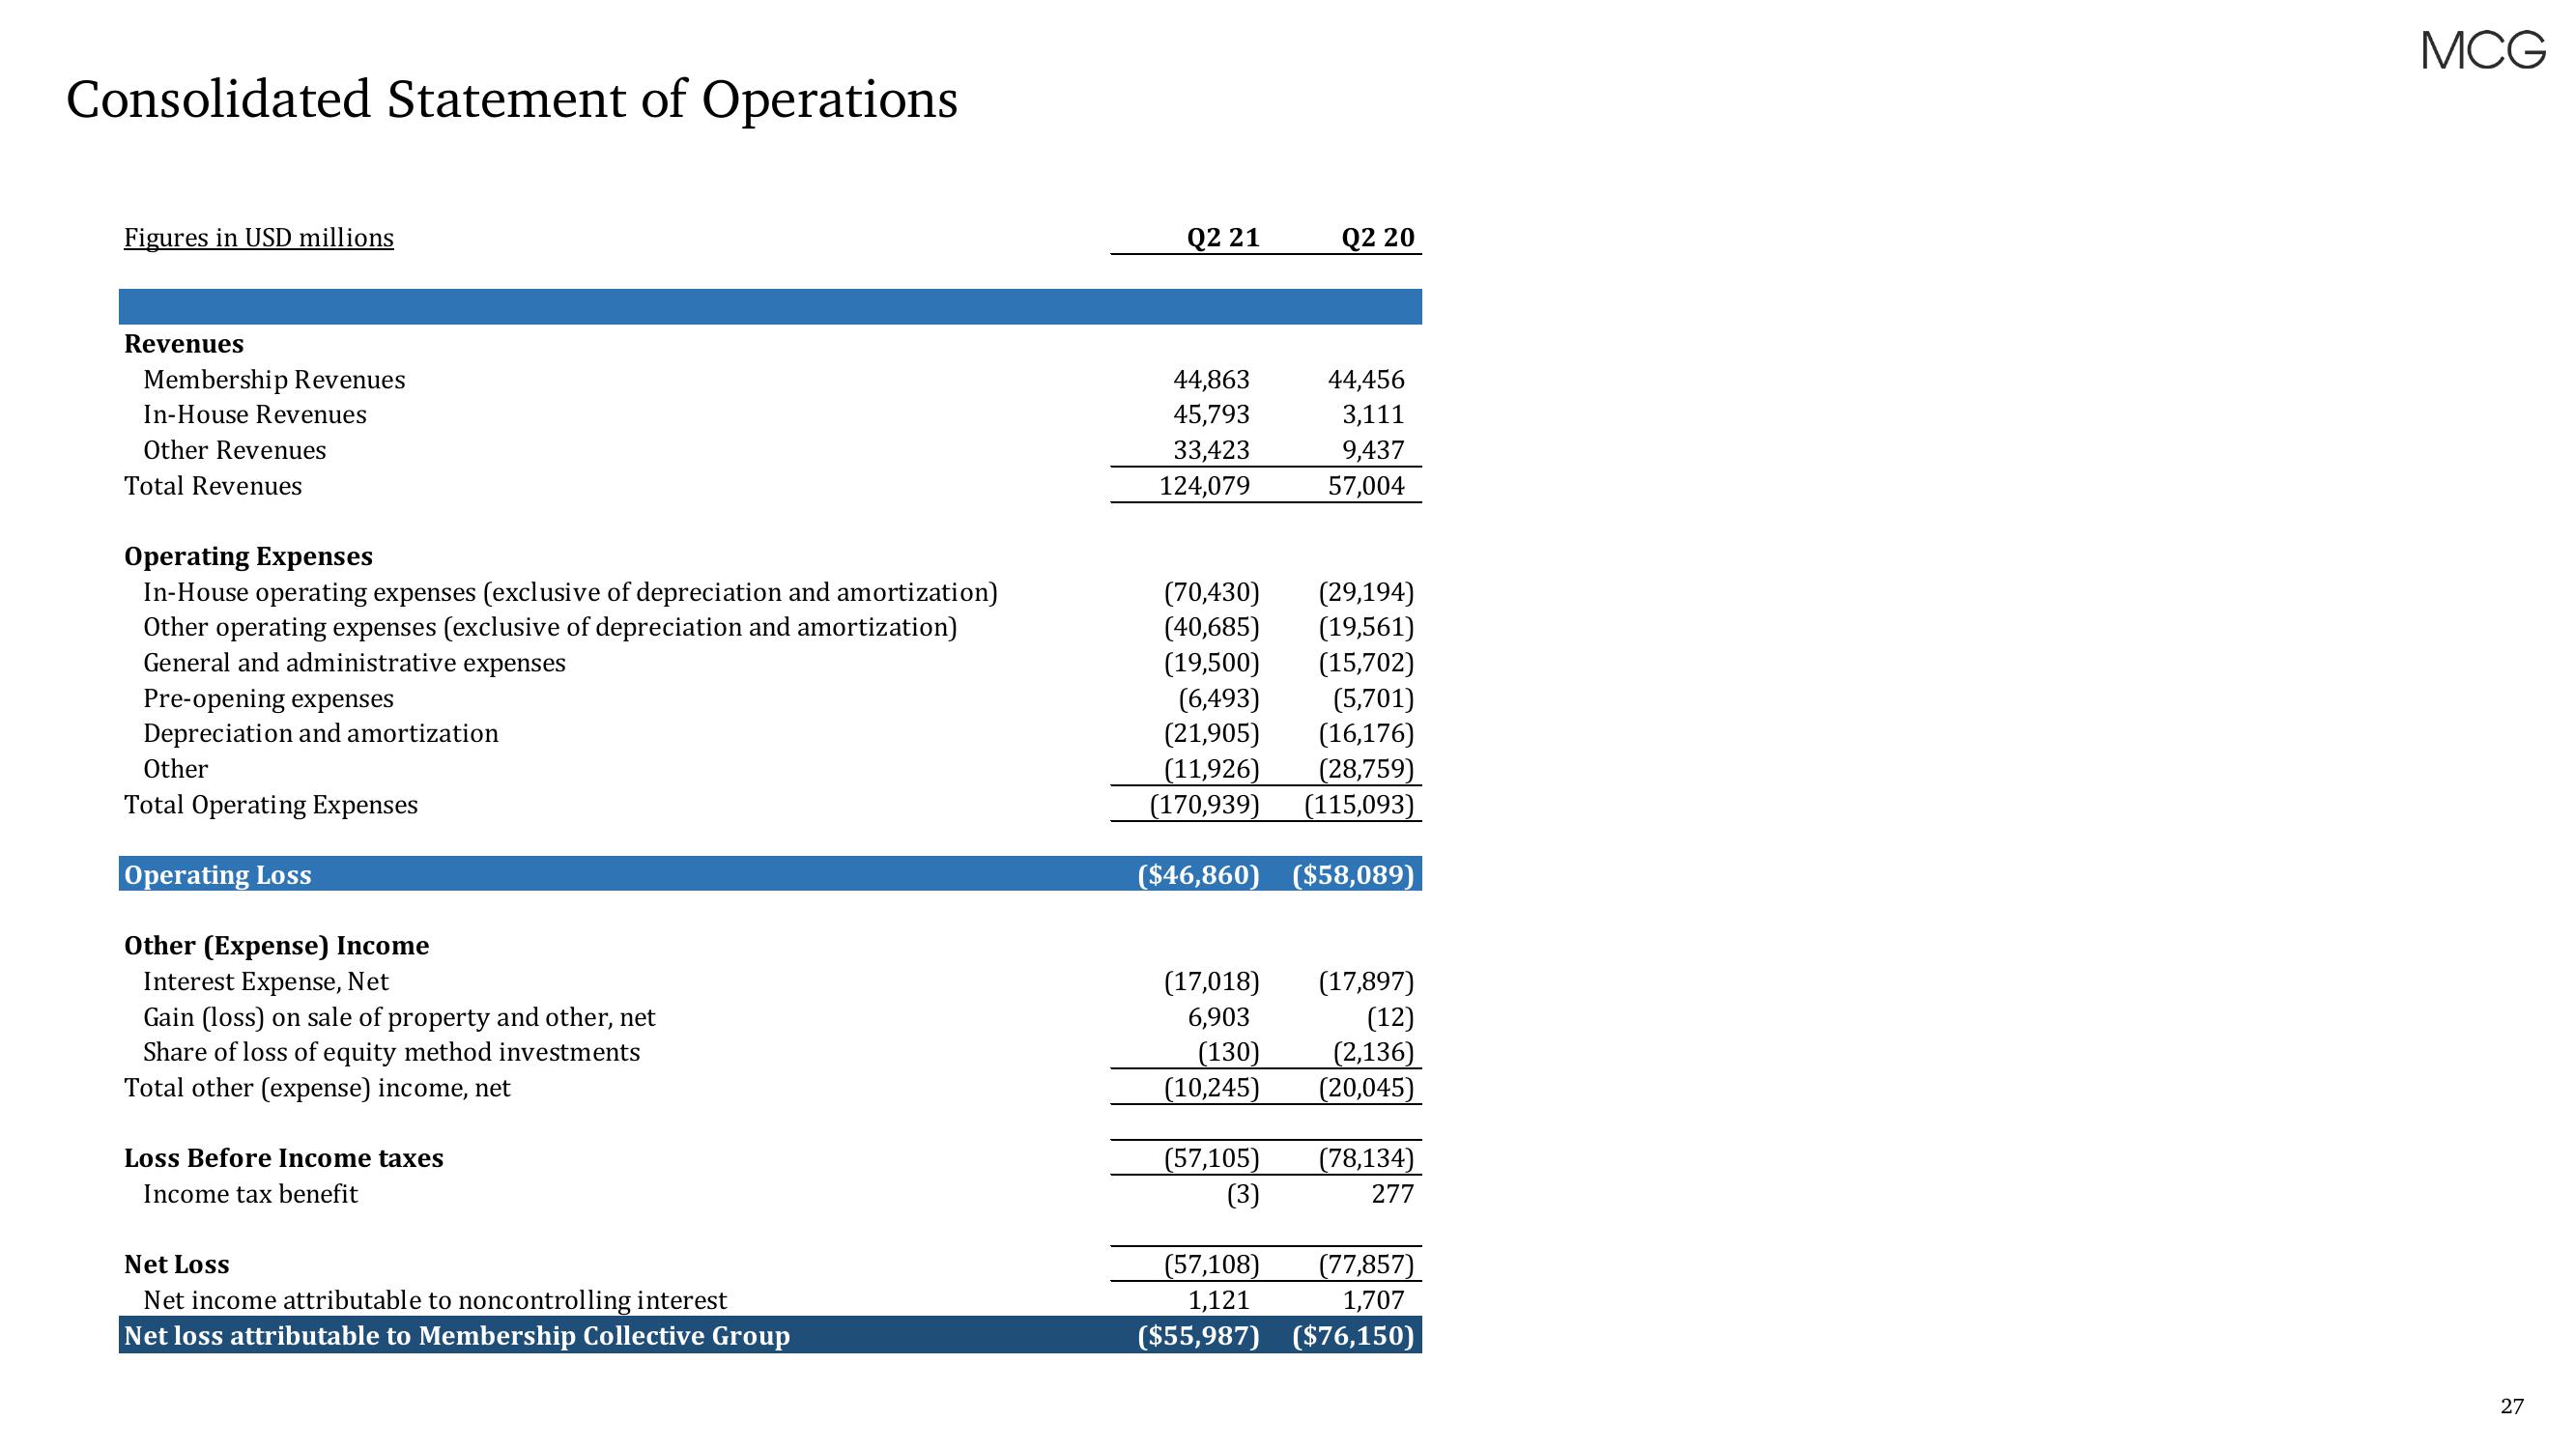
Consolidated Statement of Operations
Figures in USD millions
Revenues
Membership Revenues
In-House Revenues
Other Revenues
Total Revenues
Operating Expenses
In-House operating expenses (exclusive of depreciation and amortization)
Other operating expenses (exclusive of depreciation and amortization)
General and administrative expenses
Pre-opening expenses
Depreciation and amortization
Other
Total Operating Expenses
Operating Loss
Other (Expense) Income
Interest Expense, Net
Gain (loss) on sale of property and other, net
Share of loss of equity method investments
Total other (expense) income, net
Loss Before Income taxes
Income tax benefit
Net Loss
Net income attributable to noncontrolling interest
Net loss attributable to Membership Collective Group
Q2 21
44,863
45,793
33,423
124,079
(17,018)
6,903
(70,430)
(29,194)
(40,685)
(19,561)
(19,500)
(15,702)
(6,493)
(5,701)
(21,905)
(16,176)
(11,926)
(28,759)
(170,939) (115,093)
($46,860) ($58,089)
(130)
(10,245)
(57,105)
(3)
Q2 20
(57,108)
1,121
($55,987)
44,456
3,111
9,437
57,004
(17,897)
(12)
(2,136)
(20,045)
(78,134)
277
(77,857)
1,707
($76,150)
MCG
27View entire presentation