Roblox Results Presentation Deck
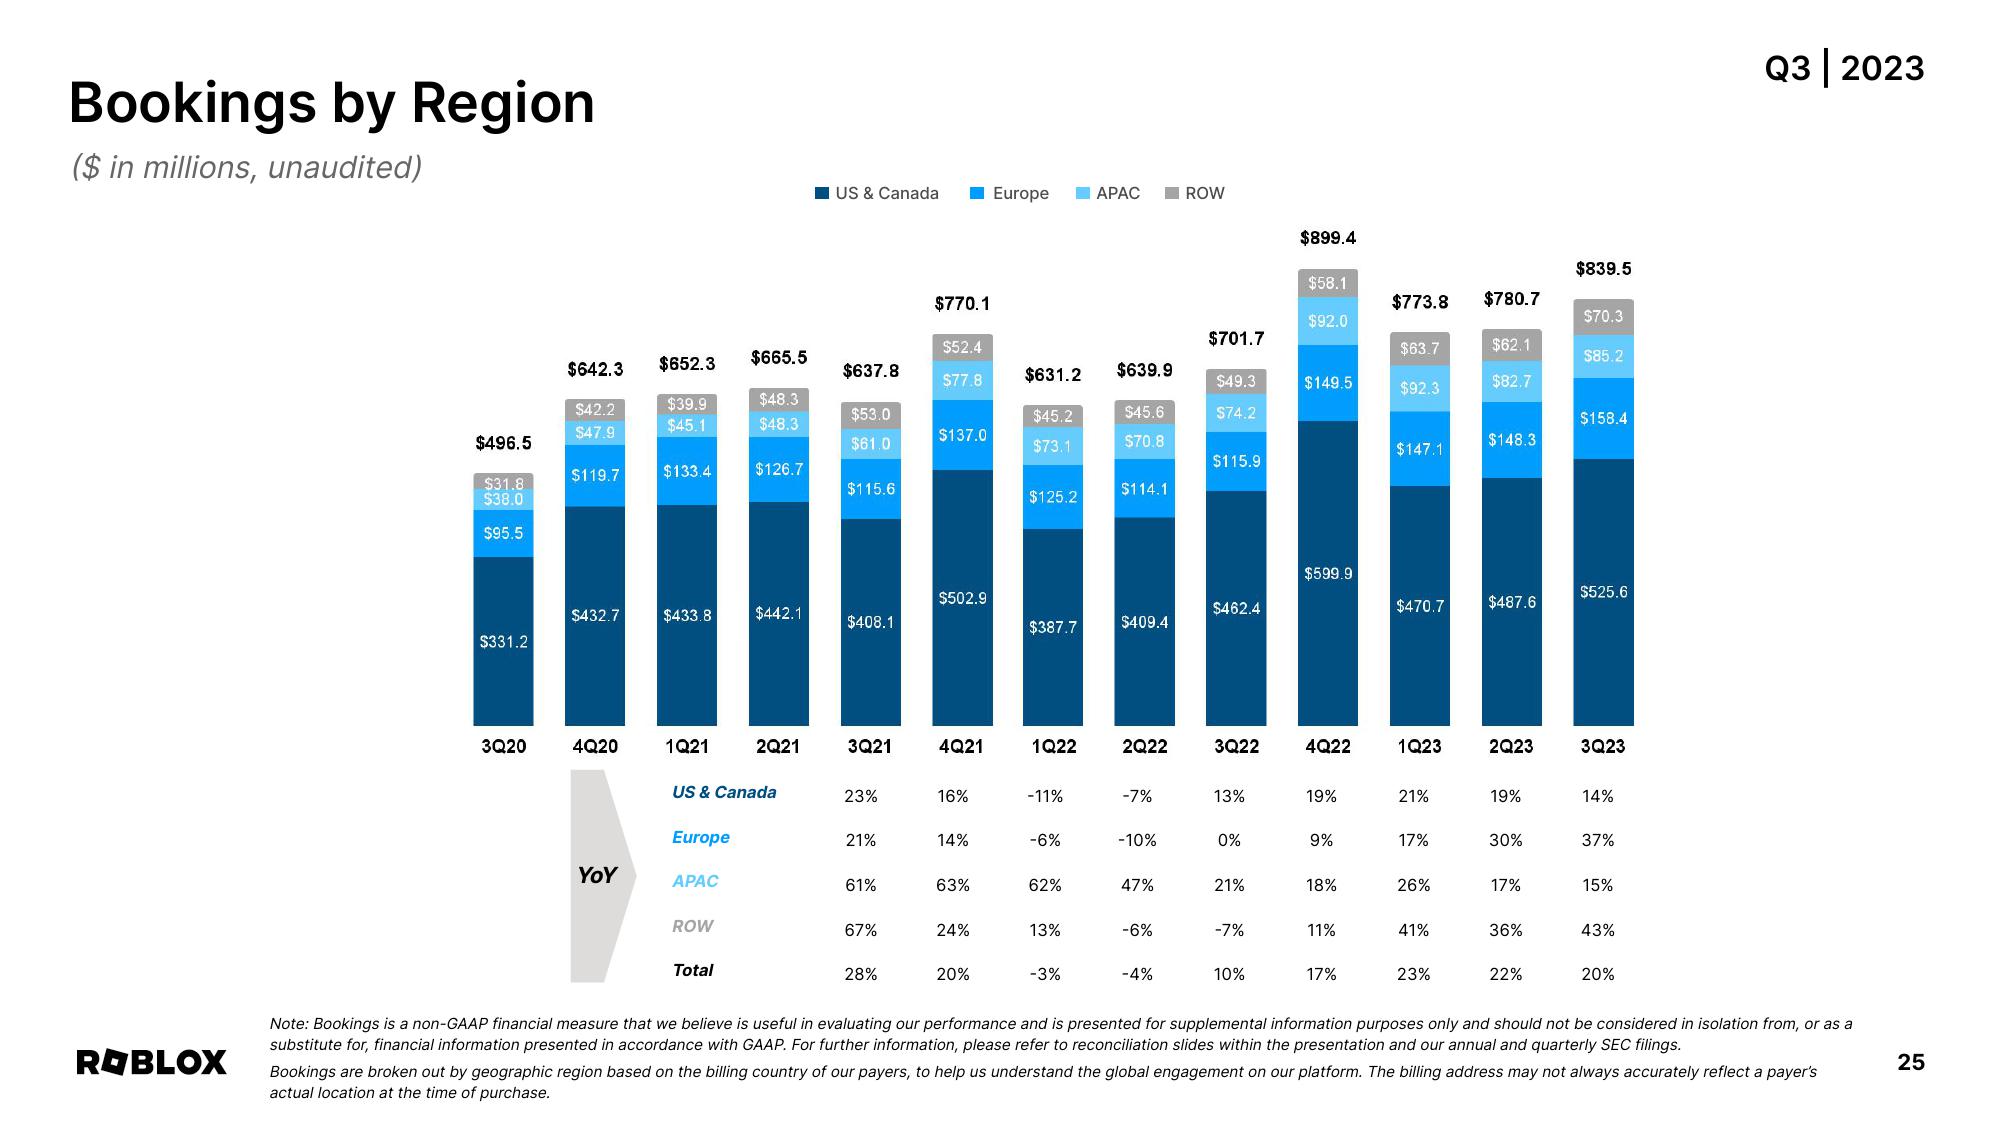
Bookings by Region
($ in millions, unaudited)
ROBLOX
$496.5
$31.8
$38.0
$95.5
$331.2
3Q20
$642.3 $652.3
$39.9
$45.1
$42.2
$47.9
$119.7
$432.7
4Q20
YOY
$133.4
$433.8
1Q21
Europe
APAC
ROW
$665.5
Total
$48.3
$48.3
US & Canada
$126.7
$442.1
2Q21
US & Canada
$637.8
$53.0
$61.0
$115.6
$408.1
3Q21
23%
21%
61%
67%
28%
$770.1
$52.4
$77.8
$137.0
$502.9
4Q21
16%
14%
63%
24%
20%
Europe
$631.2 $639.9
$45.2
$73.1
$45.6
$70.8
$125.2
$387.7
1Q22
-11%
-6%
62%
13%
APAC
-3%
$114.1
$409.4
2Q22
-7%
-10%
47%
-6%
-4%
ROW
$701.7
$49.3
$74.2
$115.9
$462.4
3Q22
13%
0%
21%
-7%
10%
$899.4
$58.1
$92.0
$149.5
$599.9
4Q22
19%
9%
18%
11%
17%
$773.8 $780.7
$62.1
$82.7
$63.7
$92.3
$147.1
$470.7
1Q23
21%
17%
26%
41%
23%
$148.3
$487.6
2Q23
19%
30%
17%
36%
22%
$839.5
$70.3
$85.2
$158.4
$525.6
3Q23
14%
37%
15%
43%
20%
Q3 | 2023
Note: Bookings is a non-GAAP financial measure that we believe is useful in evaluating our performance and is presented for supplemental information purposes only and should not be considered in isolation from, or as a
substitute for, financial information presented in accordance with GAAP. For further information, please refer to reconciliation slides within the presentation and our annual and quarterly SEC filings.
Bookings are broken out by geographic region based on the billing country of our payers, to help us understand the global engagement on our platform. The billing address may not always accurately reflect a payer's
actual location at the time of purchase.
25View entire presentation