TPG Results Presentation Deck
First Quarter and Last Twelve Months Highlights
Actual
Non-GAAP
Financial
Measures
($M)
Pro Forma
Non-GAAP
Financial
Measures
($M)
Operating
Metrics
($B)
I
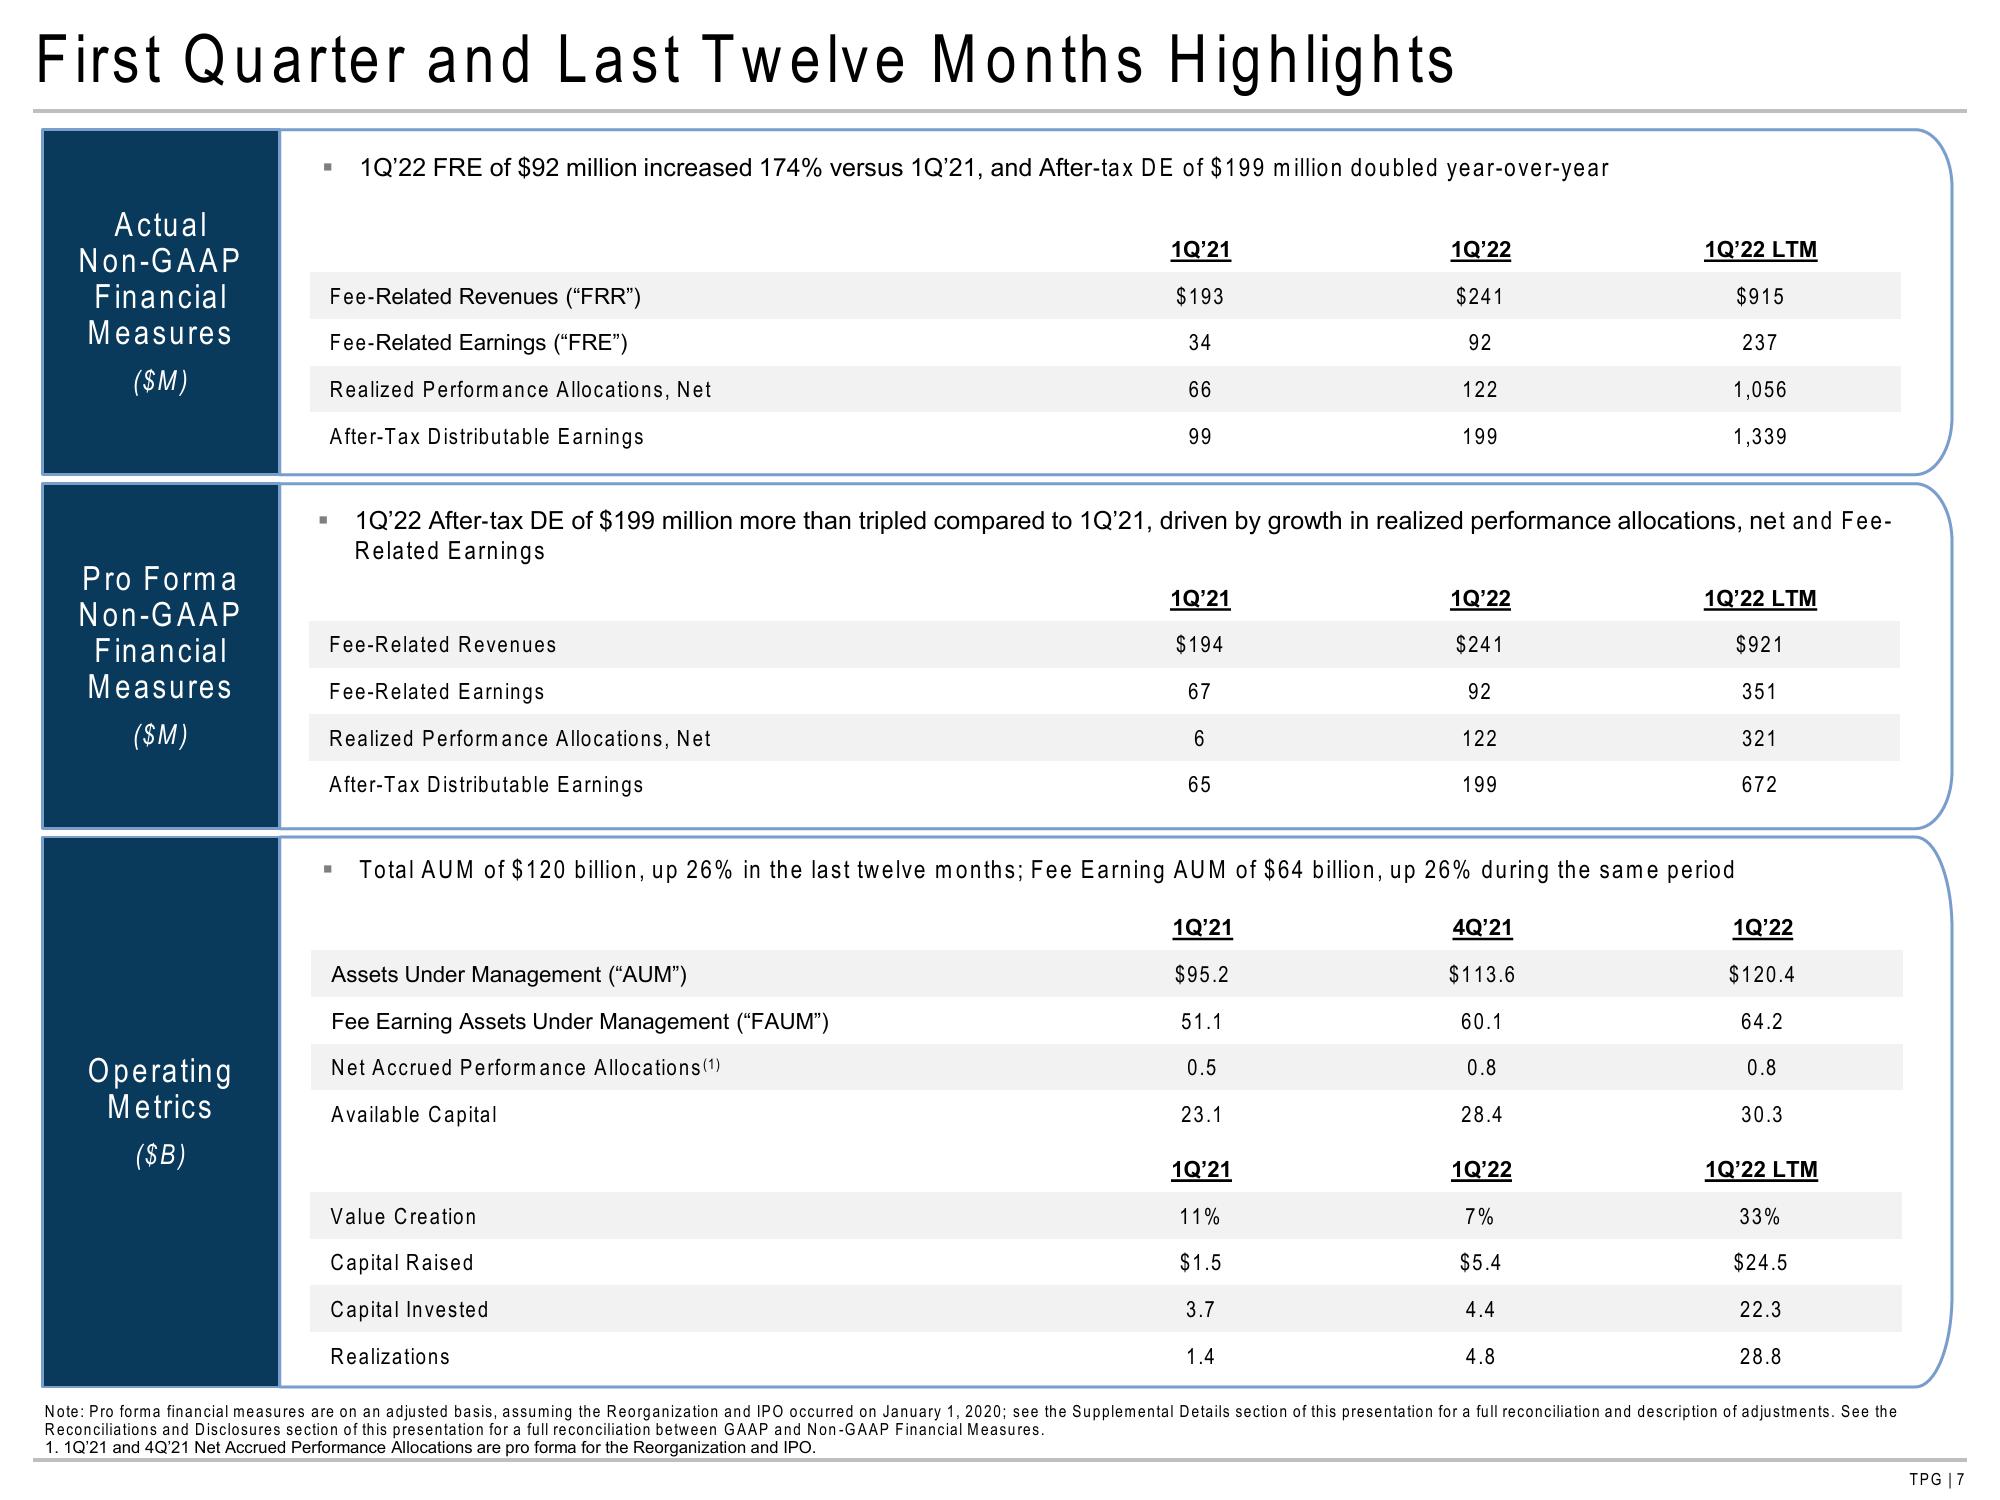
1Q'22 FRE of $92 million increased 174% versus 1Q'21, and After-tax DE of $199 million doubled year-over-year
Fee-Related Revenues ("FRR")
Fee-Related Earnings ("FRE")
Realized Performance Allocations, Net
After-Tax Distributable Earnings
■
Fee-Related Revenues
Fee-Related Earnings
Realized Performance Allocations, Net
After-Tax Distributable Earnings
Assets Under Management ("AUM")
Fee Earning Assets Under Management ("FAUM")
Net Accrued Performance Allocations (1)
Available Capital
1Q'21
$193
34
66
99
1Q'22 After-tax DE of $199 million more than tripled compared to 1Q'21, driven by growth in realized performance allocations, net and Fee-
Related Earnings
Value Creation
Capital Raised
Capital Invested
Realizations
1Q'21
$194
67
6
65
1Q'21
$95.2
51.1
0.5
Total AUM of $120 billion, up 26% in the last twelve months; Fee Earning AUM of $64 billion, up 26% during the same period
23.1
1Q'22
$241
92
122
199
1Q'21
11%
$1.5
3.7
1.4
1Q'22
$241
92
122
199
4Q'21
$113.6
60.1
0.8
28.4
1Q'22
7%
$5.4
1Q'22 LTM
4.4
$915
237
1,056
1,339
4.8
1Q'22 LTM
$921
351
321
672
1Q'22
$120.4
64.2
0.8
30.3
1Q'22 LTM
33%
$24.5
22.3
28.8
Note: Pro forma financial measures are on an adjusted basis, assuming the Reorganization and IPO occurred on January 1, 2020; see the Supplemental Details section of this presentation for a full reconciliation and description of adjustments. See the
Reconciliations and Disclosures section of this presentation for a full reconciliation between GAAP and Non-GAAP Financial Measures.
1. 1Q'21 and 4Q'21 Net Accrued Performance Allocations are pro forma for the Reorganization and IPO.
TPG 17View entire presentation