Hilltop Holdings Results Presentation Deck
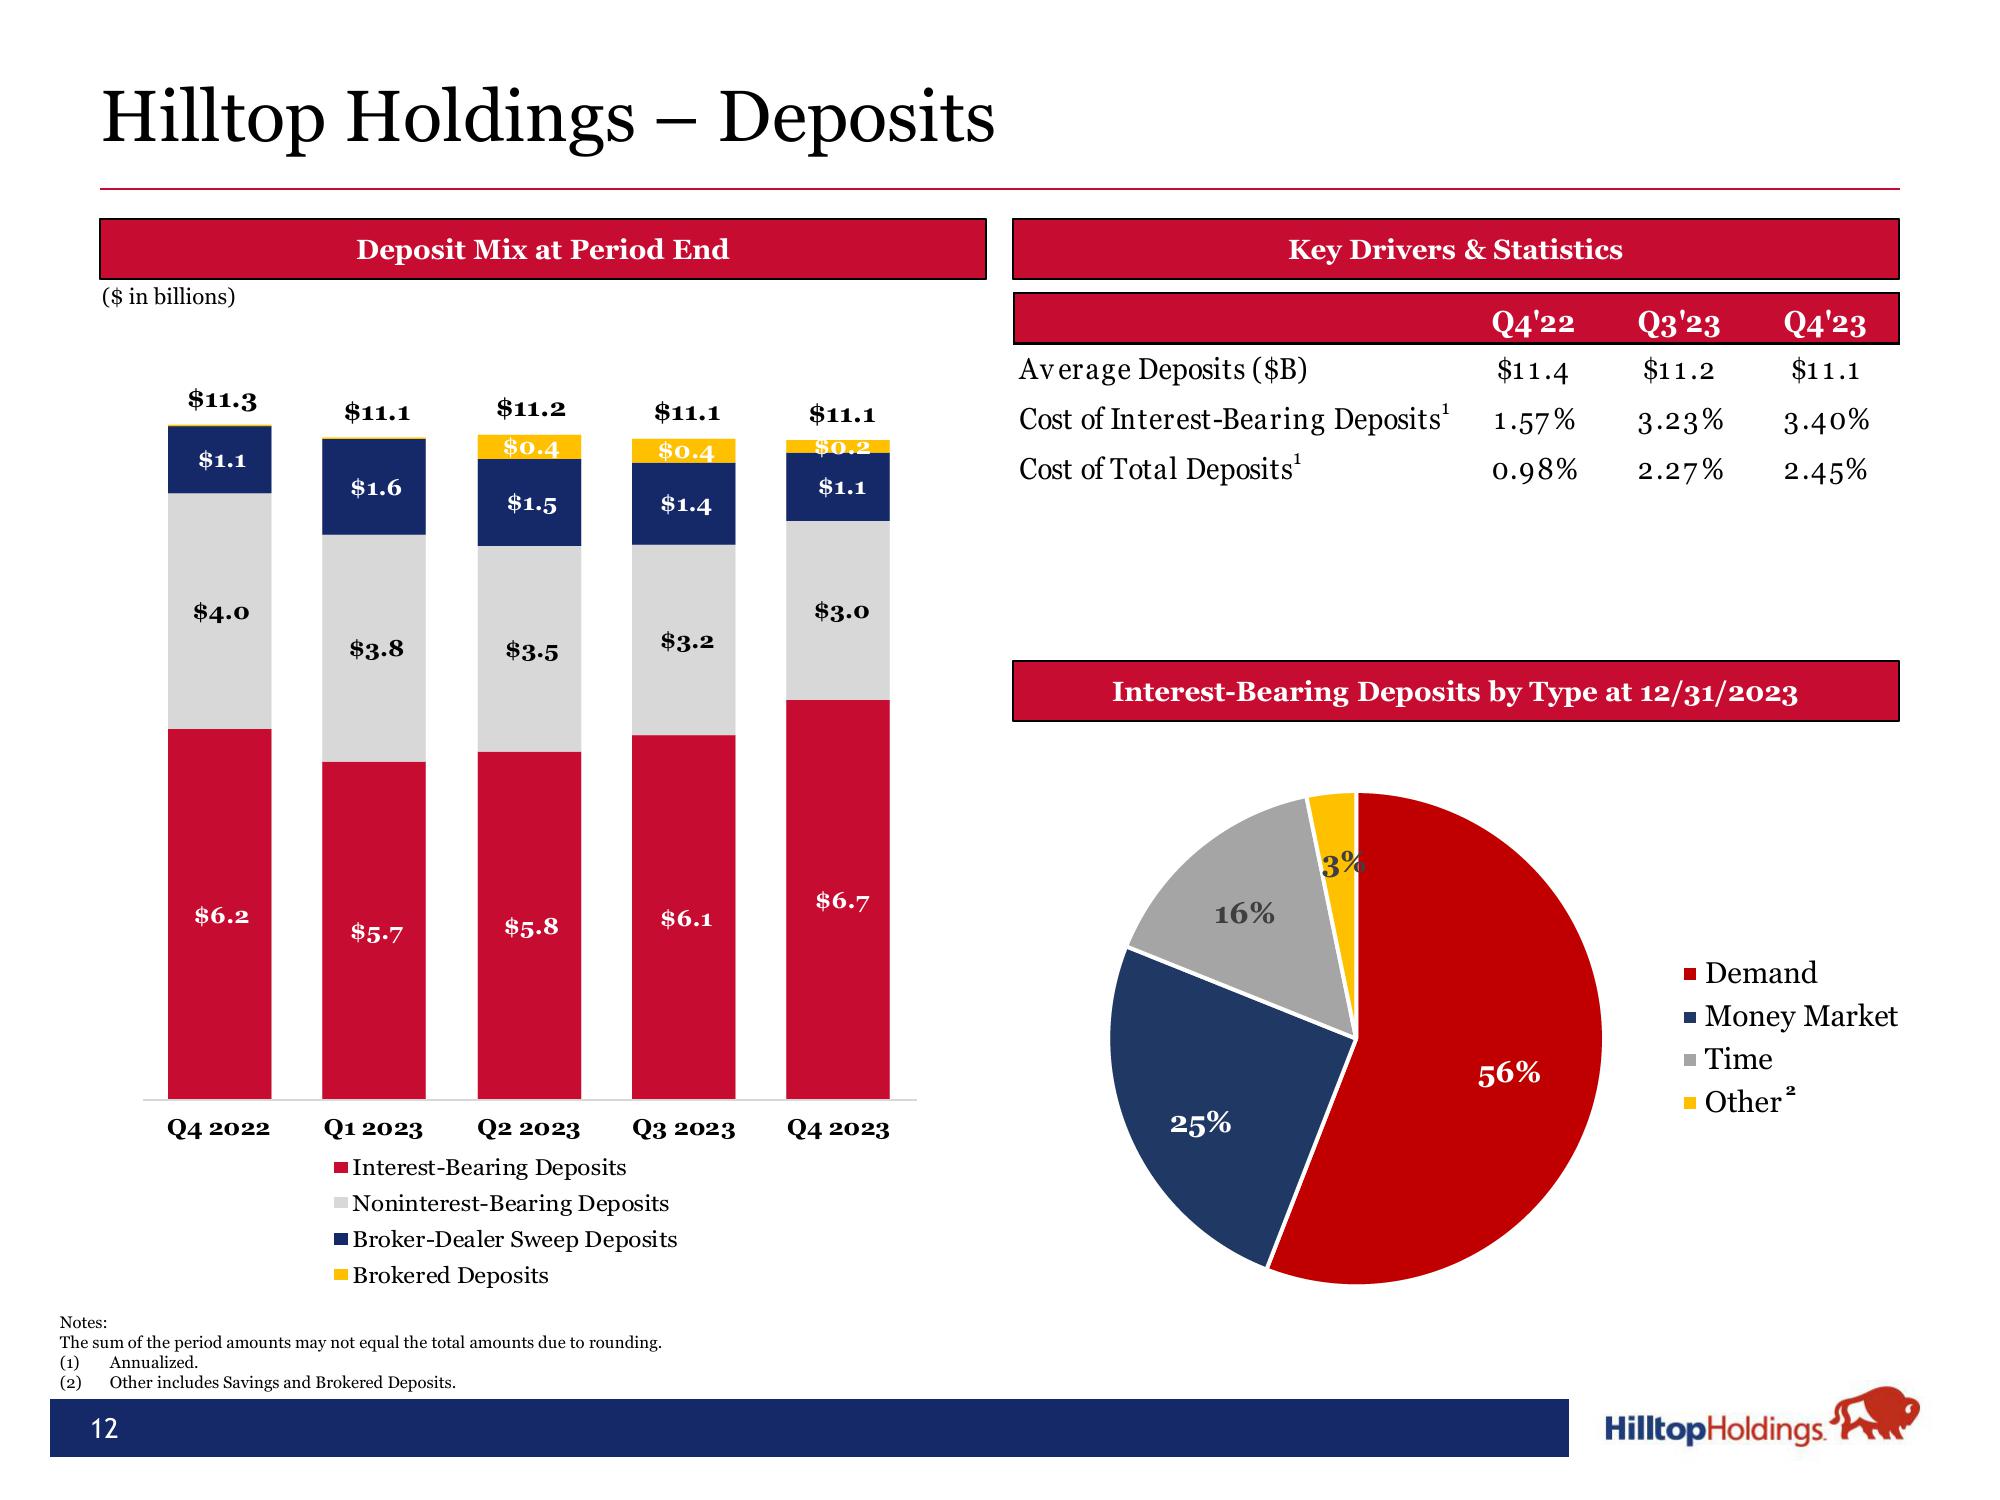
Hilltop Holdings - Deposits
($ in billions)
$11.3
12
$1.1
$4.0
$6.2
Q4 2022
Deposit Mix at Period End
$11.1
$1.6
$3.8
$5.7
$11.2
$0.4
$1.5
$3.5
$5.8
$11.1
$0.4
$1.4
$3.2
$6.1
Q1 2023 Q2 2023 Q3 2023
Interest-Bearing Deposits
Noninterest-Bearing Deposits
■Broker-Dealer Sweep Deposits
Brokered Deposits
Notes:
The sum of the period amounts may not equal the total amounts due to rounding.
Annualized.
(1)
(2) Other includes Savings and Brokered Deposits.
$11.1
$0.2
$1.1
$3.0
$6.7
Q4 2023
Average Deposits ($B)
Cost of Interest-Bearing Deposits¹
Cost of Total Deposits¹
Key Drivers & Statistics
16%
Interest-Bearing Deposits by Type at 12/31/2023
25%
Q4'22 Q3'23
Q4'23
$11.4 $11.2
$11.1
1.57% 3.23% 3.40%
0.98% 2.27% 2.45%
3%
56%
■ Demand
▪ Money Market
■ Time
2
■ Other ²
Hilltop Holdings.View entire presentation