Experian Investor Presentation Deck
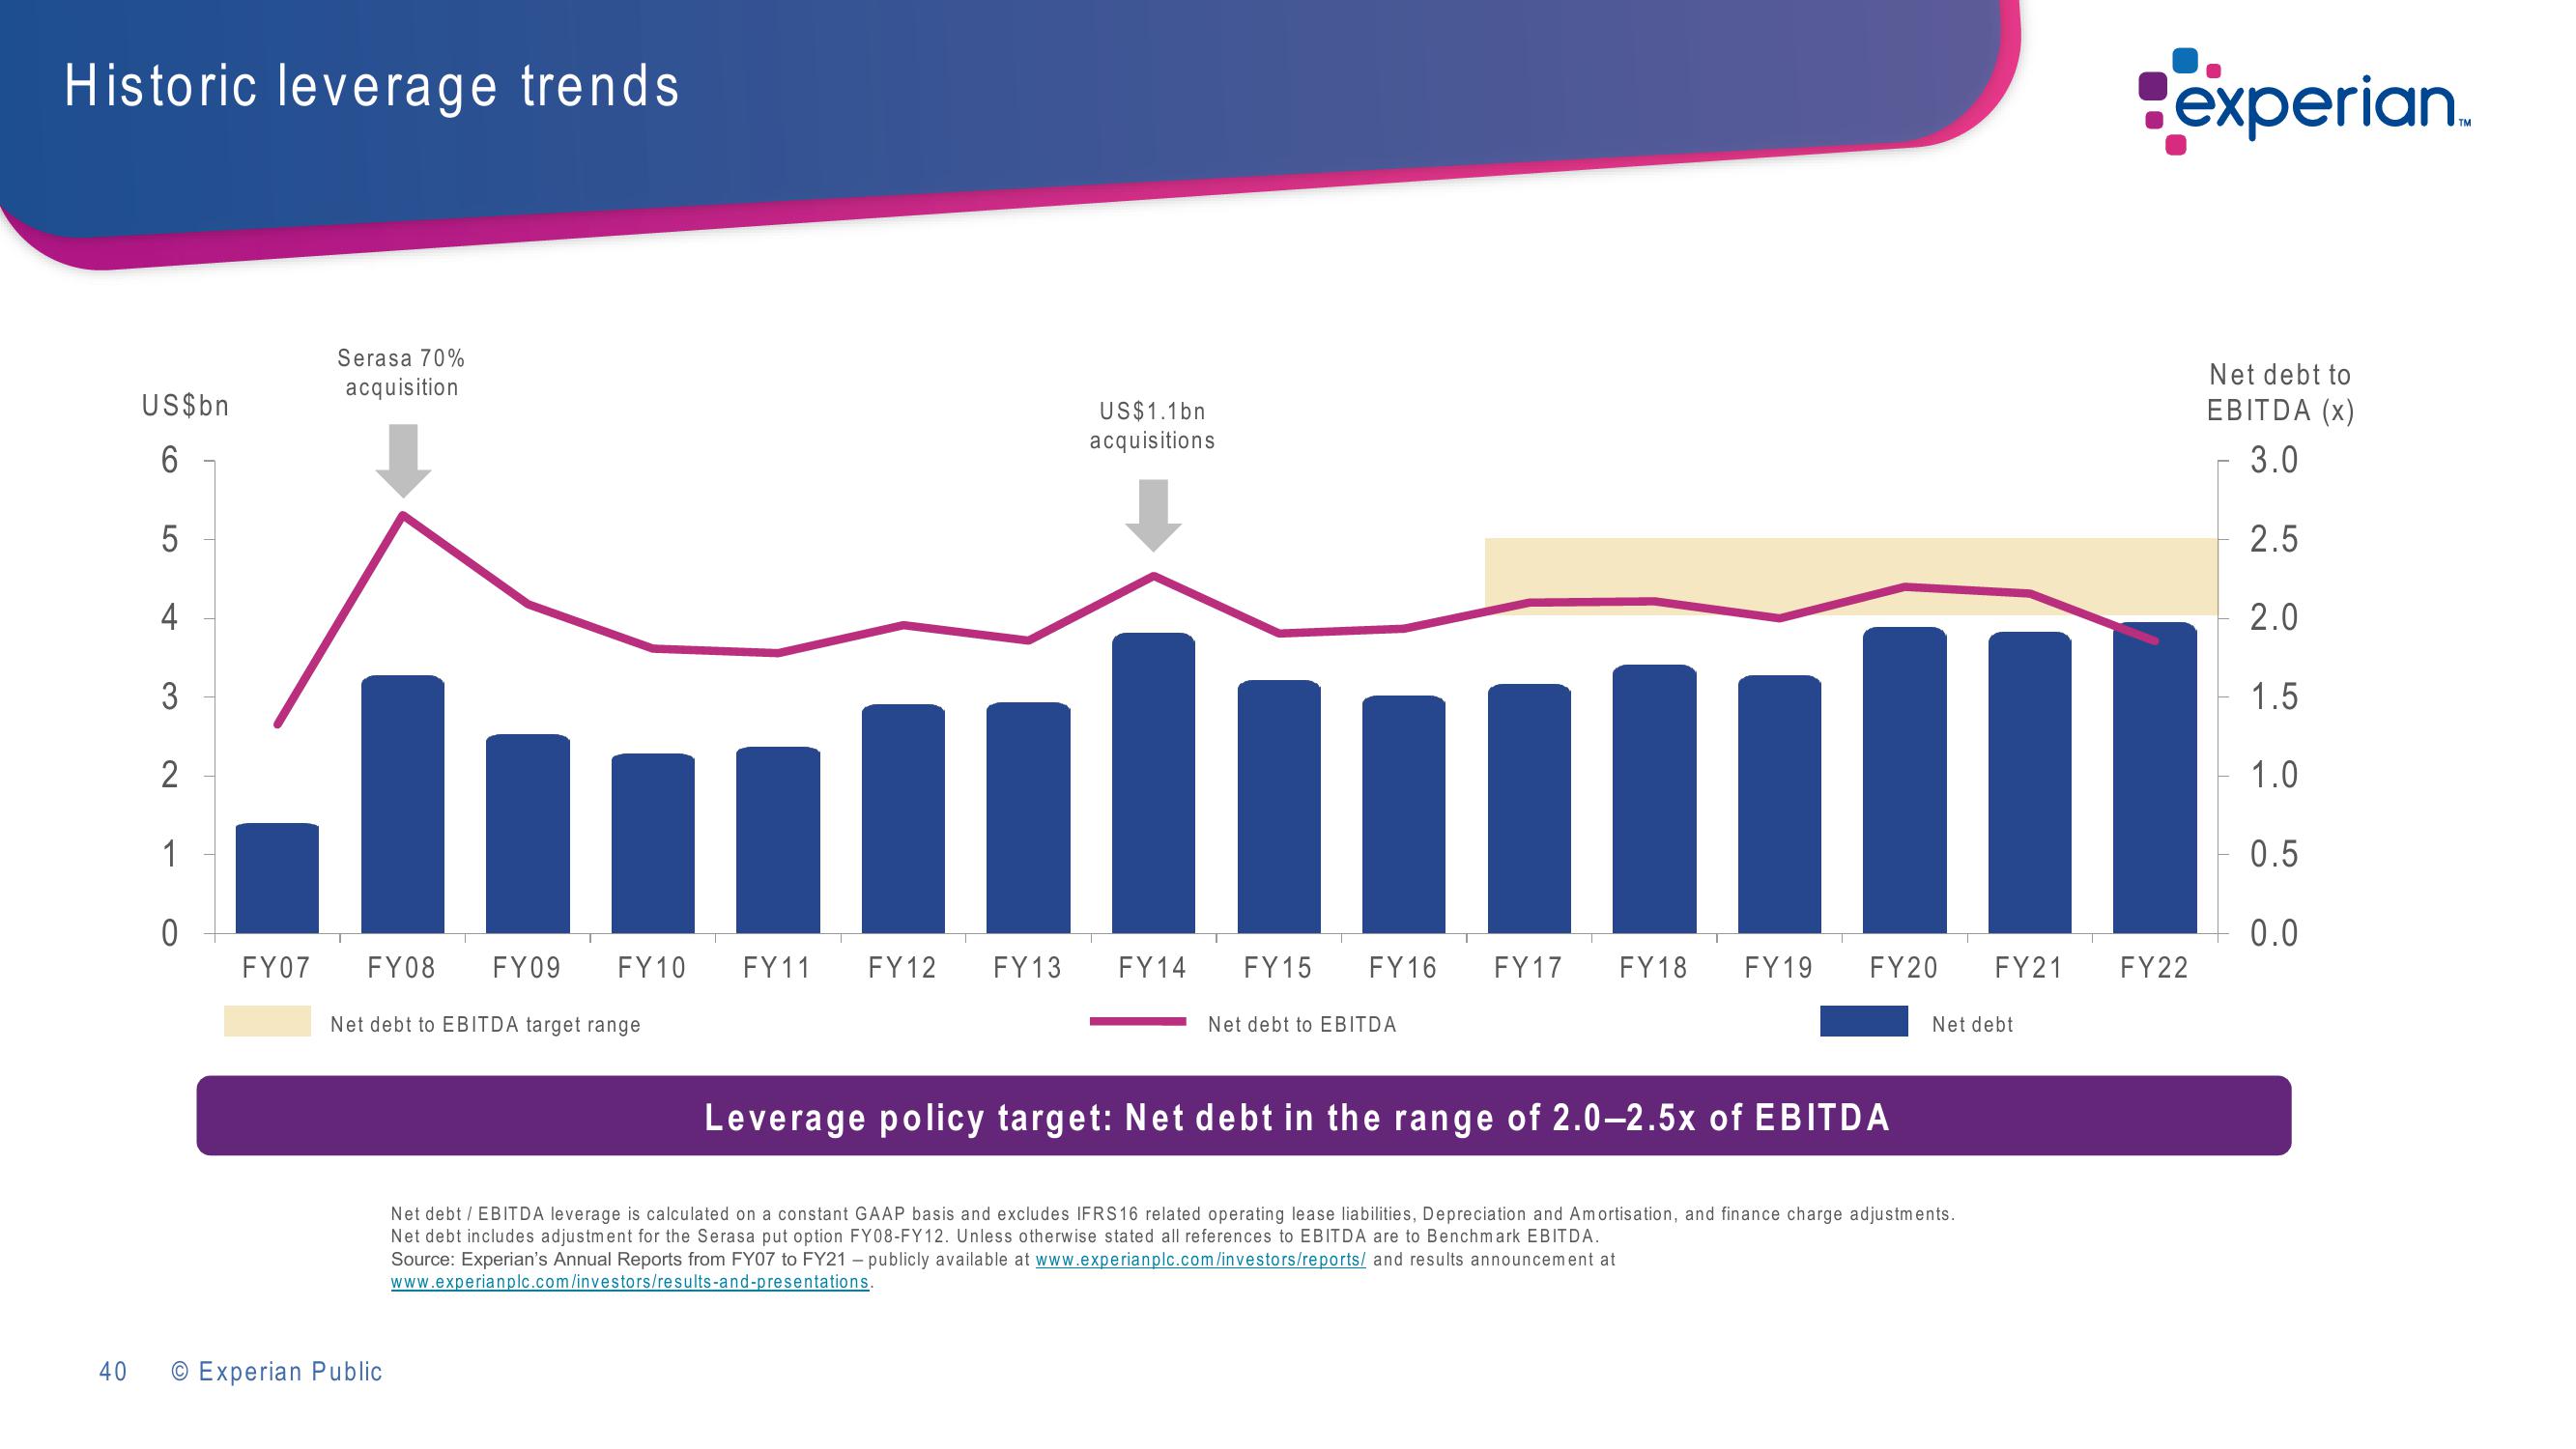
Historic leverage trends
40
US$bn
6
LO
5
4
3
2
1
0
Serasa 70%
acquisition
In
FY08
FY09 FY10
Net debt to EBITDA target range
FY07
O Experian Public
FY11
US$1.1bn
acquisitions
1
FY12 FY13 FY14
FY15 FY16 FY17
Net debt to EBITDA
FY18 FY19
FY20 FY21
Net debt
Leverage policy target: Net debt in the range of 2.0-2.5x of EBITDA
Net debt / EBITDA leverage is calculated on a constant GAAP basis and excludes IFRS16 related operating lease liabilities, Depreciation and Amortisation, and finance charge adjustments.
Net debt includes adjustment for the Serasa put option FY08-FY12. Unless otherwise stated all references to EBITDA are to Benchmark EBITDA.
Source: Experian's Annual Reports from FY07 to FY21 - publicly available at www.experianplc.com/investors/reports/ and results announcement at
www.experianplc.com/investors/results-and-presentations.
experian..
FY22
Net debt to
EBITDA (x)
3.0
2.5
2.0
1.5
1.0
0.5
0.0View entire presentation