jetBlue Results Presentation Deck
Outlook Summary
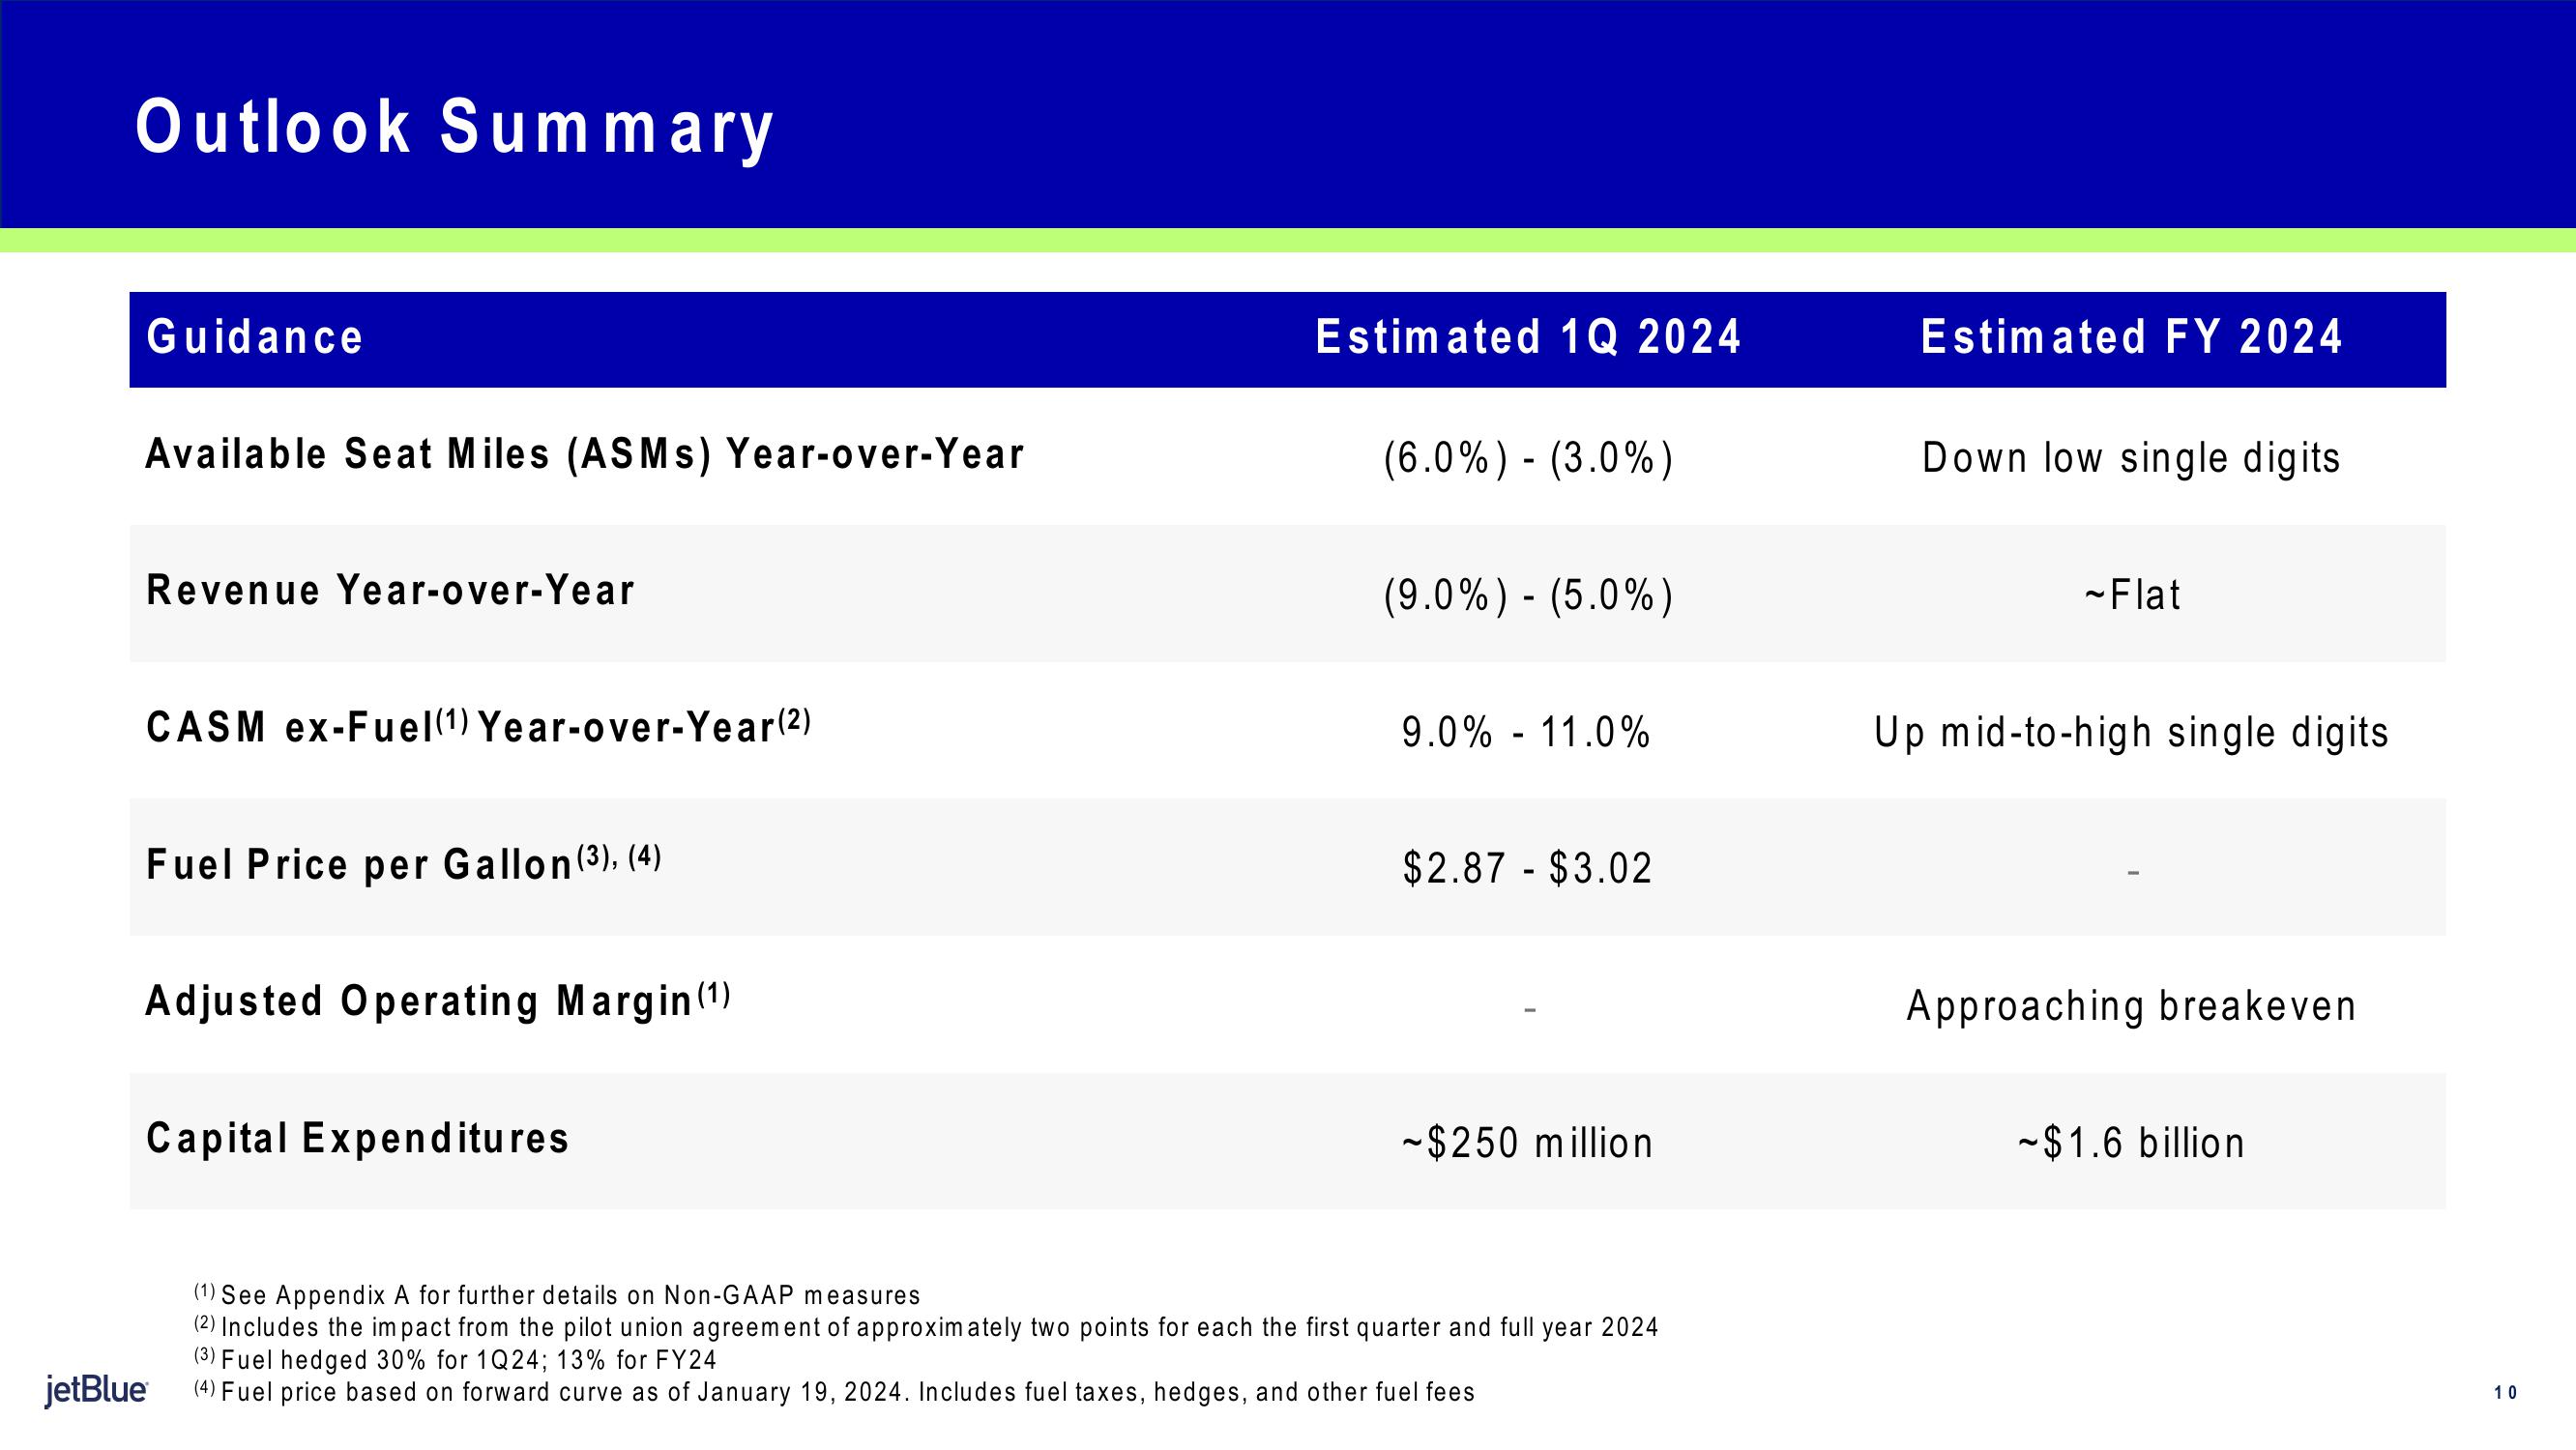
Guidance
Available Seat Miles (ASMS) Year-over-Year
Revenue Year-over-Year
CASM ex-Fuel (1) Year-over-Year(2)
Fuel Price per Gallon (3), (4)
Adjusted Operating Margin (1)
Capital Expenditures
jetBlue
Estimated 1Q 2024
(6.0%) - (3.0%)
(9.0%) - (5.0%)
9.0% 11.0%
$2.87 $3.02
-$250 million
(1) See Appendix A for further details on Non-GAAP measures
(2) Includes the impact from the pilot union agreement of approximately two points for each the first quarter and full year 2024
(3) Fuel hedged 30% for 1Q24; 13% for FY24
(4) Fuel price based on forward curve as of January 19, 2024. Includes fuel taxes, hedges, and other fuel fees
Estimated FY 2024
Down low single digits
-Flat
Up mid-to-high single digits
Approaching breakeven
-$1.6 billion
10View entire presentation