Oatly Results Presentation Deck
EMEA GROWTH SNAPSHOT
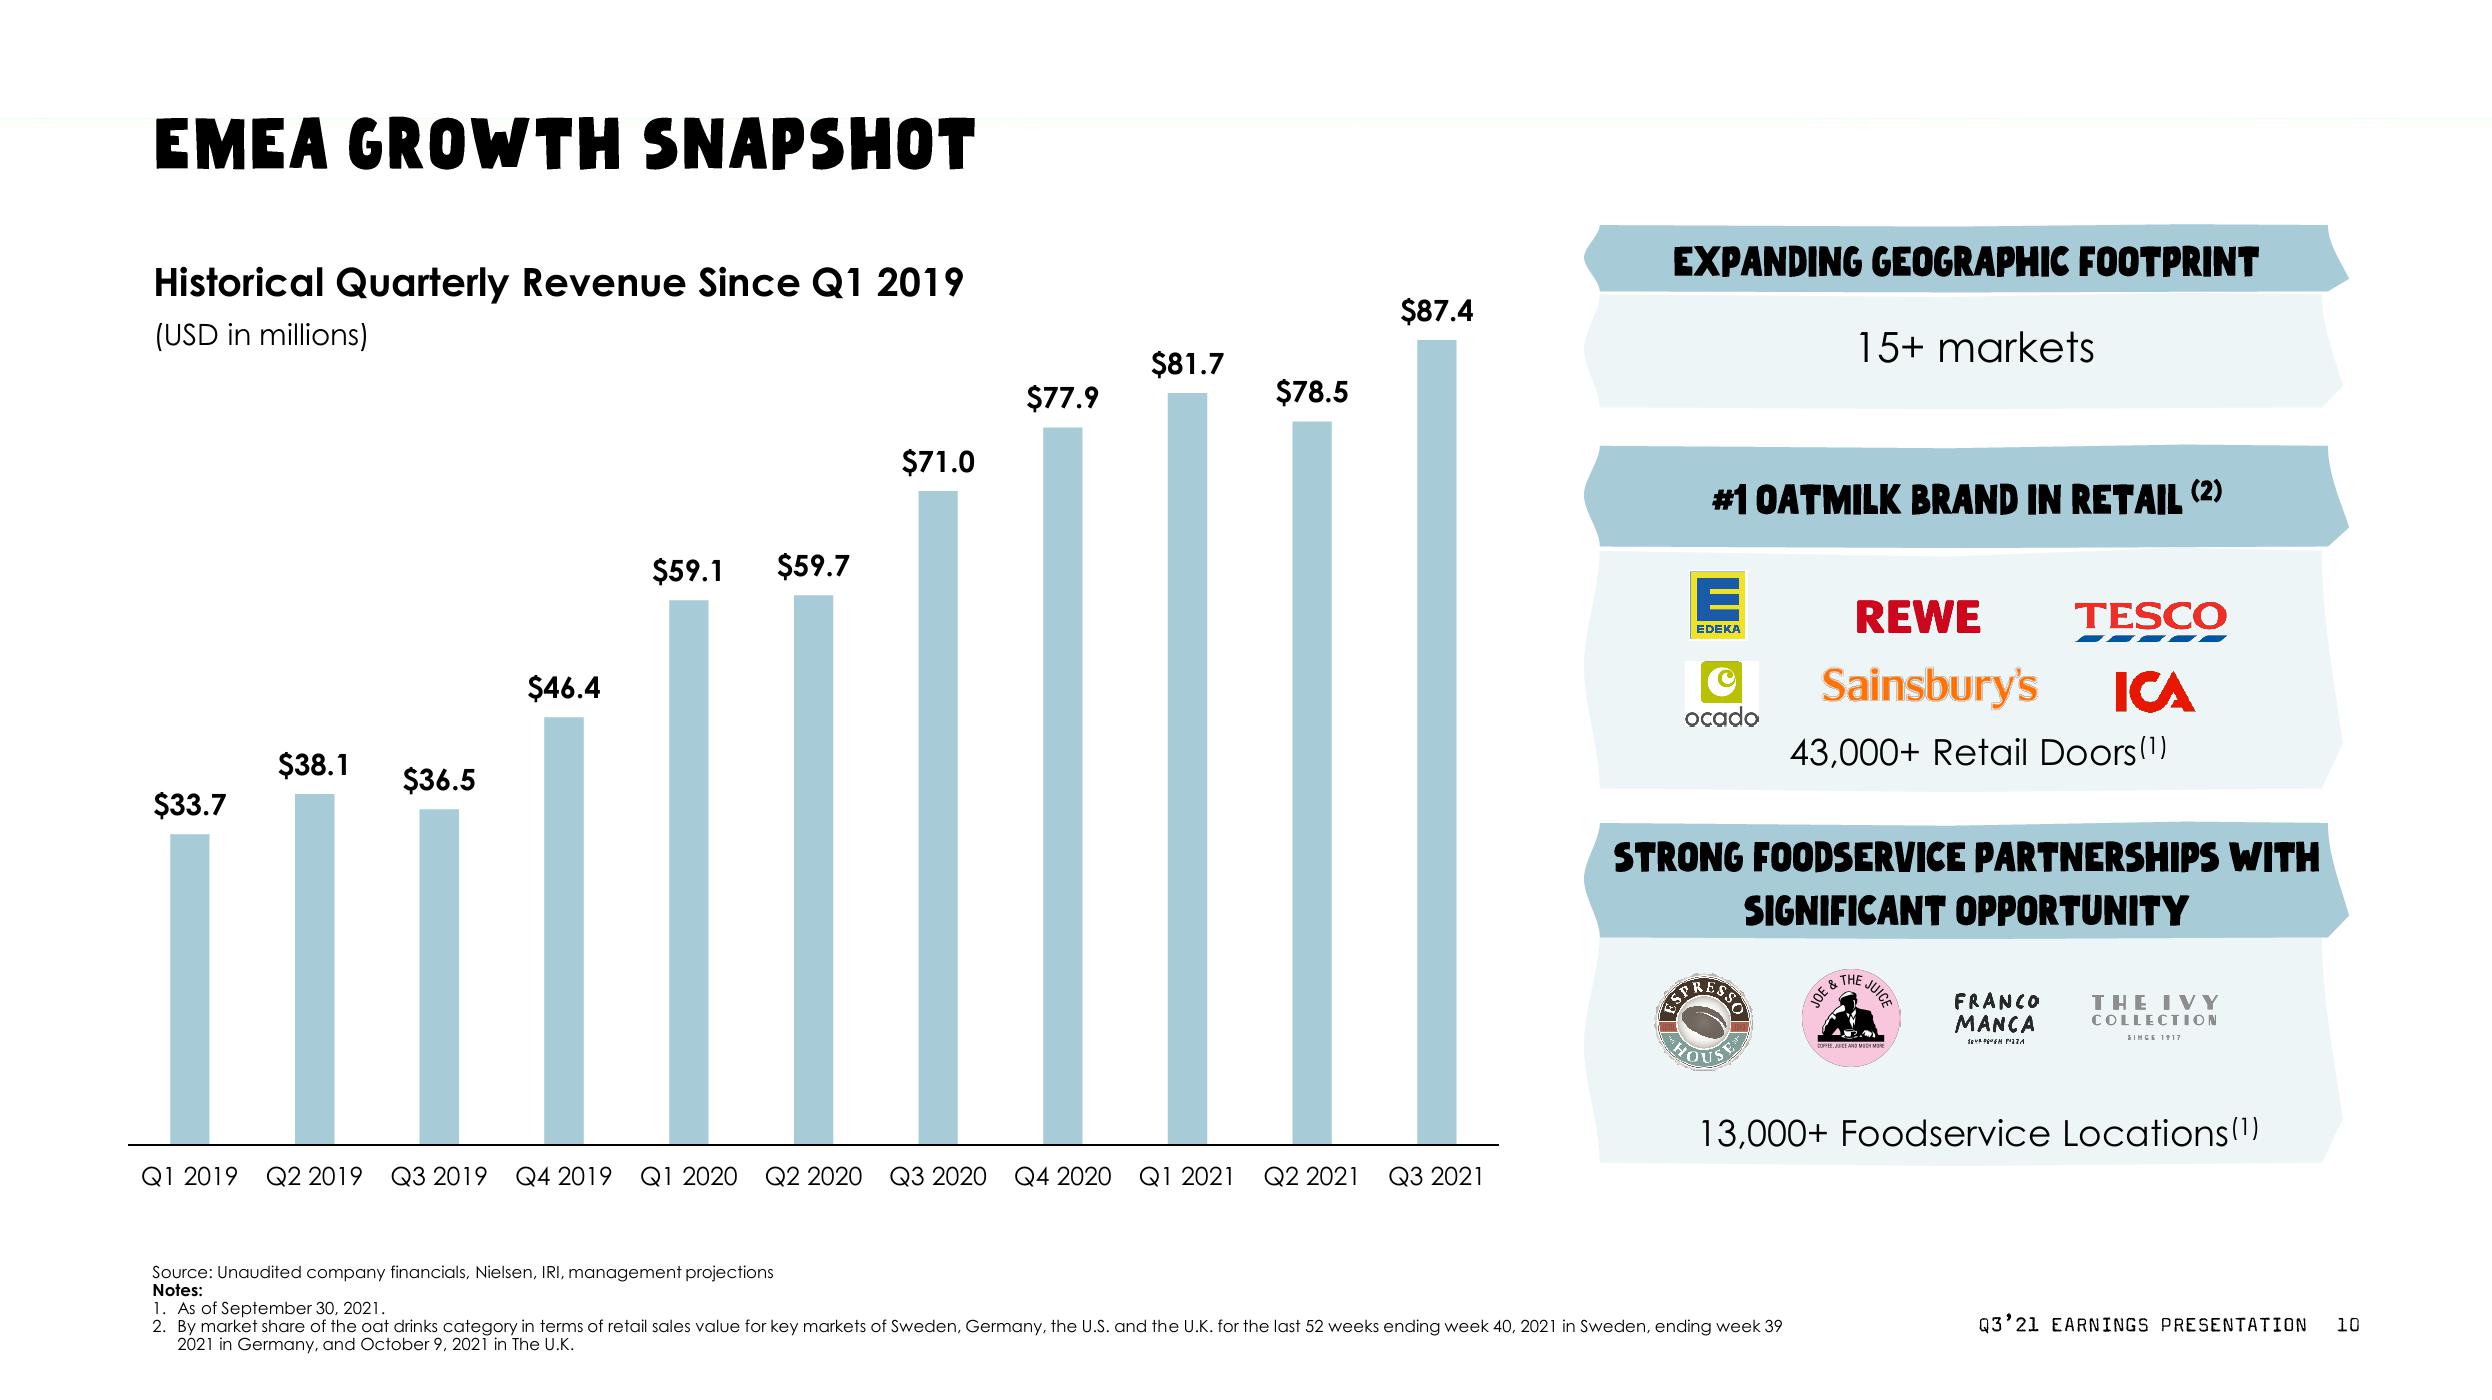
Historical Quarterly Revenue Since Q1 2019
(USD in millions)
$33.7
$38.1
$36.5
$46.4
$59.1 $59.7
$71.0
Source: Unaudited company financials, Nielsen, IRI, management projections
Notes:
$77.9
$81.7
$78.5
$87.4
Q1 2019 Q2 2019 Q3 2019 Q4 2019 Q1 2020 Q2 2020 Q3 2020 Q4 2020 Q1 2021 Q2 2021 Q3 2021
EXPANDING GEOGRAPHIC FOOTPRINT
#1 OATMILK BRAND IN RETAIL (2)
E
EDEKA
C
ocado
RES
15+ markets
STRONG FOODSERVICE PARTNERSHIPS WITH
SIGNIFICANT OPPORTUNITY
REWE TESCO
Sainsbury's ICA
43,000+ Retail Doors (1)
1. As of September 30, 2021.
2. By market share of the oat drinks category in terms of retail sales value for key markets of Sweden, Germany, the U.S. and the U.K. for the last 52 weeks ending week 40, 2021 in Sweden, ending week 39
2021 in Germany, and October 9, 2021 in The U.K.
JOE &
HE JUICE
OM
FRANCO
MANCA
SEM PA
THE IVY
COLLECTION
SINCE 1917
13,000+ Foodservice Locations (1)
Q3'21 EARNINGS PRESENTATION 10View entire presentation