Baird Investment Banking Pitch Book
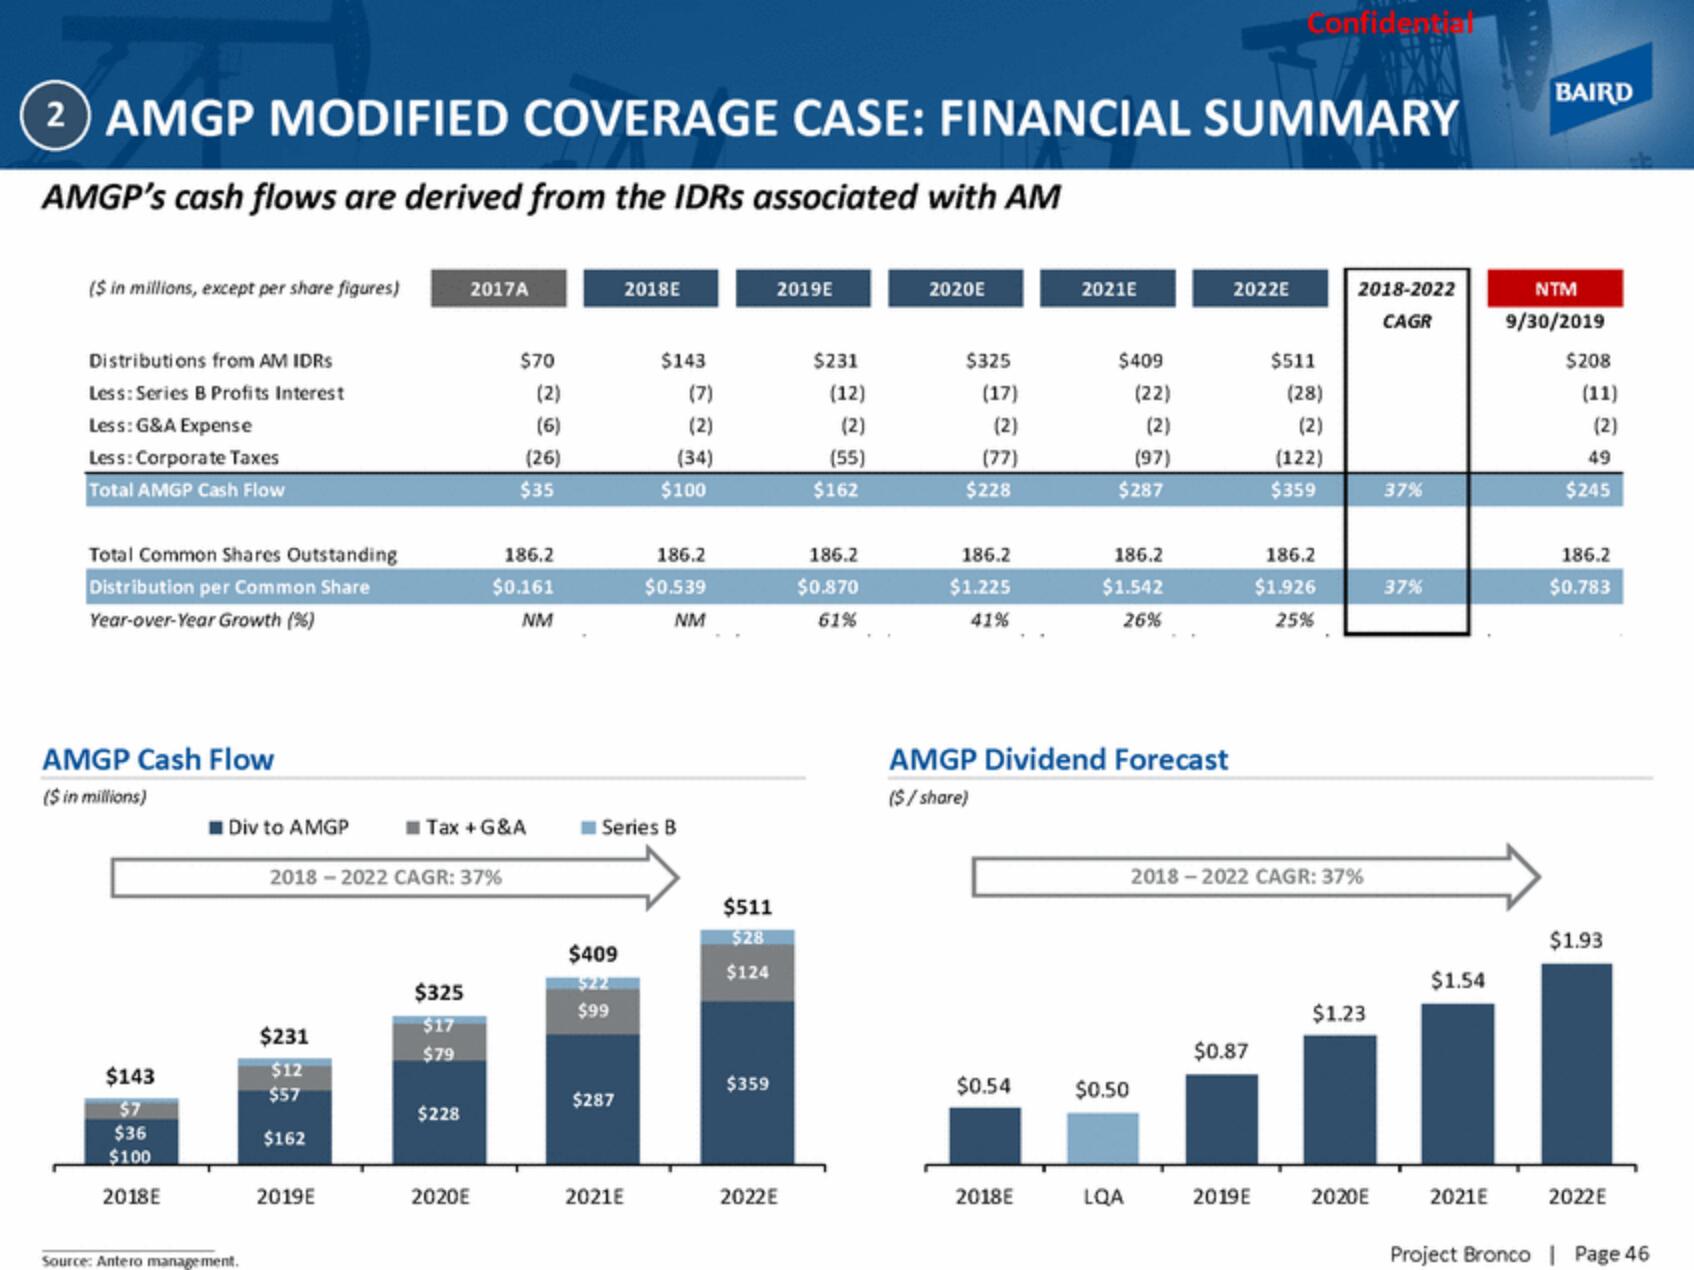
(2) AMGP MODIFIED COVERAGE CASE: FINANCIAL SUMMARY
AMGP's cash flows are derived from the IDRS associated with AM
($ in millions, except per share figures)
Distributions from AM IDRS
Less: Series B Profits Interest
Less: G&A Expense
Less: Corporate Taxes
Total AMGP Cash Flow
Total Common Shares Outstanding
Distribution per Common Share
Year-over-Year Growth (%)
AMGP Cash Flow
($ in millions)
$143
$7
$36
$100
2018E
Div to AMGP
Source: Antero management.
$231
$12
$57
$162
2019E
2018-2022 CAGR: 37%
2017A
$325
$17
$79
$228
$70
Tax + G&A
2020E
(2)
(6)
(26)
$35
186.2
$0.161
NM
$409
$22
$99
2018E
$287
$143
2021E
(7)
(2)
(34)
Series B
$100
186.2
$0.539
NM
$511
$28
$124
$359
2019E
2022E
$231
(12)
(2)
(55)
$162
186.2
$0.870
61%
2020E
$325
(17)
(2)
(77)
$228
186.2
$1.225
41%
$0.54
2021E
2018E
$409
$287
AMGP Dividend Forecast
($/share)
(22)
(2)
(97)
186.2
$1.542
26%
$0.50
LQA
2022E
Confidential
$0.87
2019E
$511
(28)
(2)
(122)
$359
2018-2022 CAGR: 37%
186.2
$1.926
25%
2018-2022
CAGR
$1.23
2020E
37%
37%
$1.54
2021E
BAIRD
NTM
9/30/2019
$208
(11)
(2)
49
$245
186.2
$0.783
$1.93
2022E
Project Bronco | Page 46View entire presentation