Solo Brands IPO Presentation Deck
Reconciliation to GAAP Metrics
27
Source: Company Information
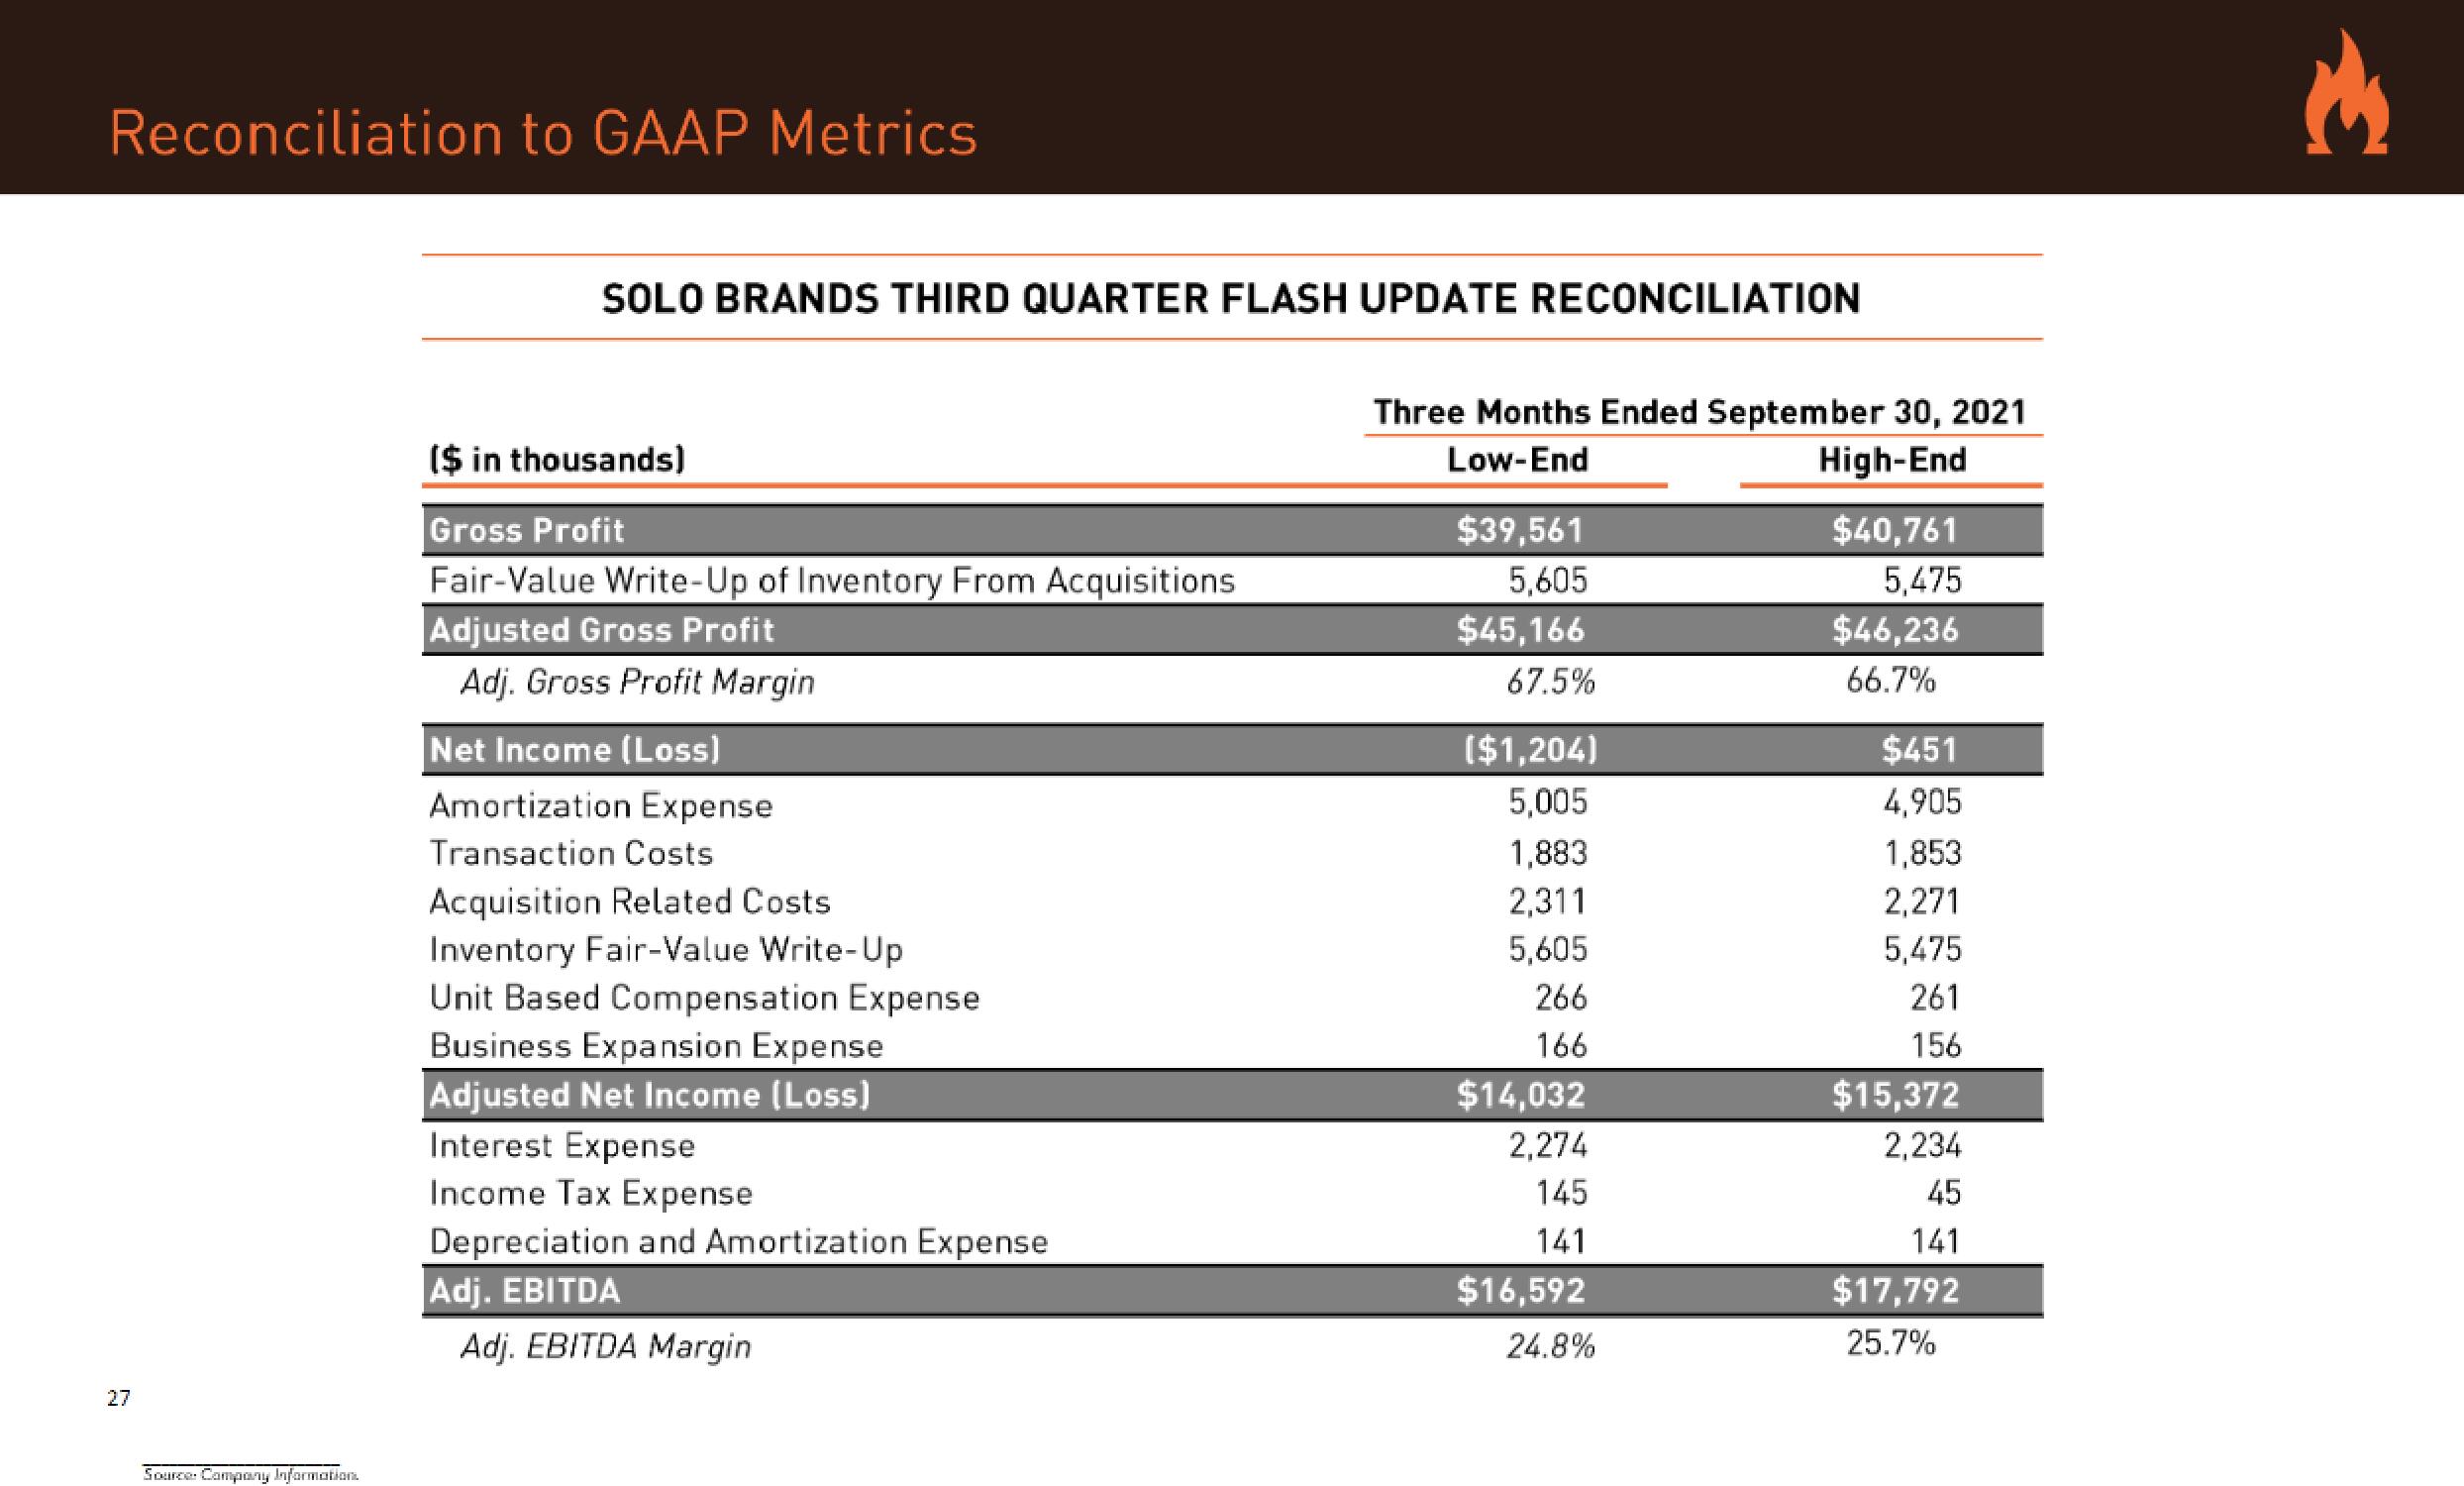
SOLO BRANDS THIRD QUARTER FLASH UPDATE RECONCILIATION
($ in thousands)
Gross Profit
Fair-Value Write-Up of Inventory From Acquisitions
Adjusted Gross Profit
Adj. Gross Profit Margin
Net Income (Loss)
Amortization Expense
Transaction Costs
Acquisition Related Costs
Inventory Fair-Value Write-Up
Unit Based Compensation Expense
Business Expansion Expense
Adjusted Net Income (Loss)
Interest Expense
Income Tax Expense
Depreciation and Amortization Expense
Adj. EBITDA
Adj. EBITDA Margin
Three Months Ended September 30, 2021
Low-End
High-End
$39,561
5,605
$45,166
67.5%
($1,204)
5,005
1,883
2,311
5,605
266
166
$14,032
2,274
145
141
$16,592
24.8%
$40,761
5,475
$46,236
66.7%
$451
4,905
1,853
2,271
5,475
261
156
$15,372
2,234
45
141
$17,792
25.7%
€View entire presentation