Oaktree Real Estate Opportunities Fund VII, L.P.
OAKTREE REAL ESTATE OPPORTUNITIES FUND VII, L.P.
Business Highlights - Real Estate Portfolio Overview (continued)
Outlook
+
FOCUS
COMMERCIAL
NON-U.S.
RESIDENTIAL
COMMERCIAL
NPLS
CORPORATE
STRUCTURED
FINANCE
% PURCHASE PRICE
TOTAL¹
56% of peak
60% of peak
41% of peak
43% of
unpaid
principal
balance
"UPB"
32% of peak
53% of peak
33% of peak
ROF VI
69% of peak
58% of peak
44% of peak
47% of UPB,
34% of peak
AVERAGE CURRENT
TOTAL³
56%
57%
36%
36%
51%
LEVERAGE²
37%
ROF V13
57%
59%
41%
46%
50%
AVERAGE NOI YIELD AFTER DEBT
SERVICE4
TOTAL5
Current: 12%
Stabilized: 15%
Current: 12%
Stabilized: 14%
1
ROF VI
Current: 11%
Stabilized: 15%
Current: 10%
Stabilized: 17%
1
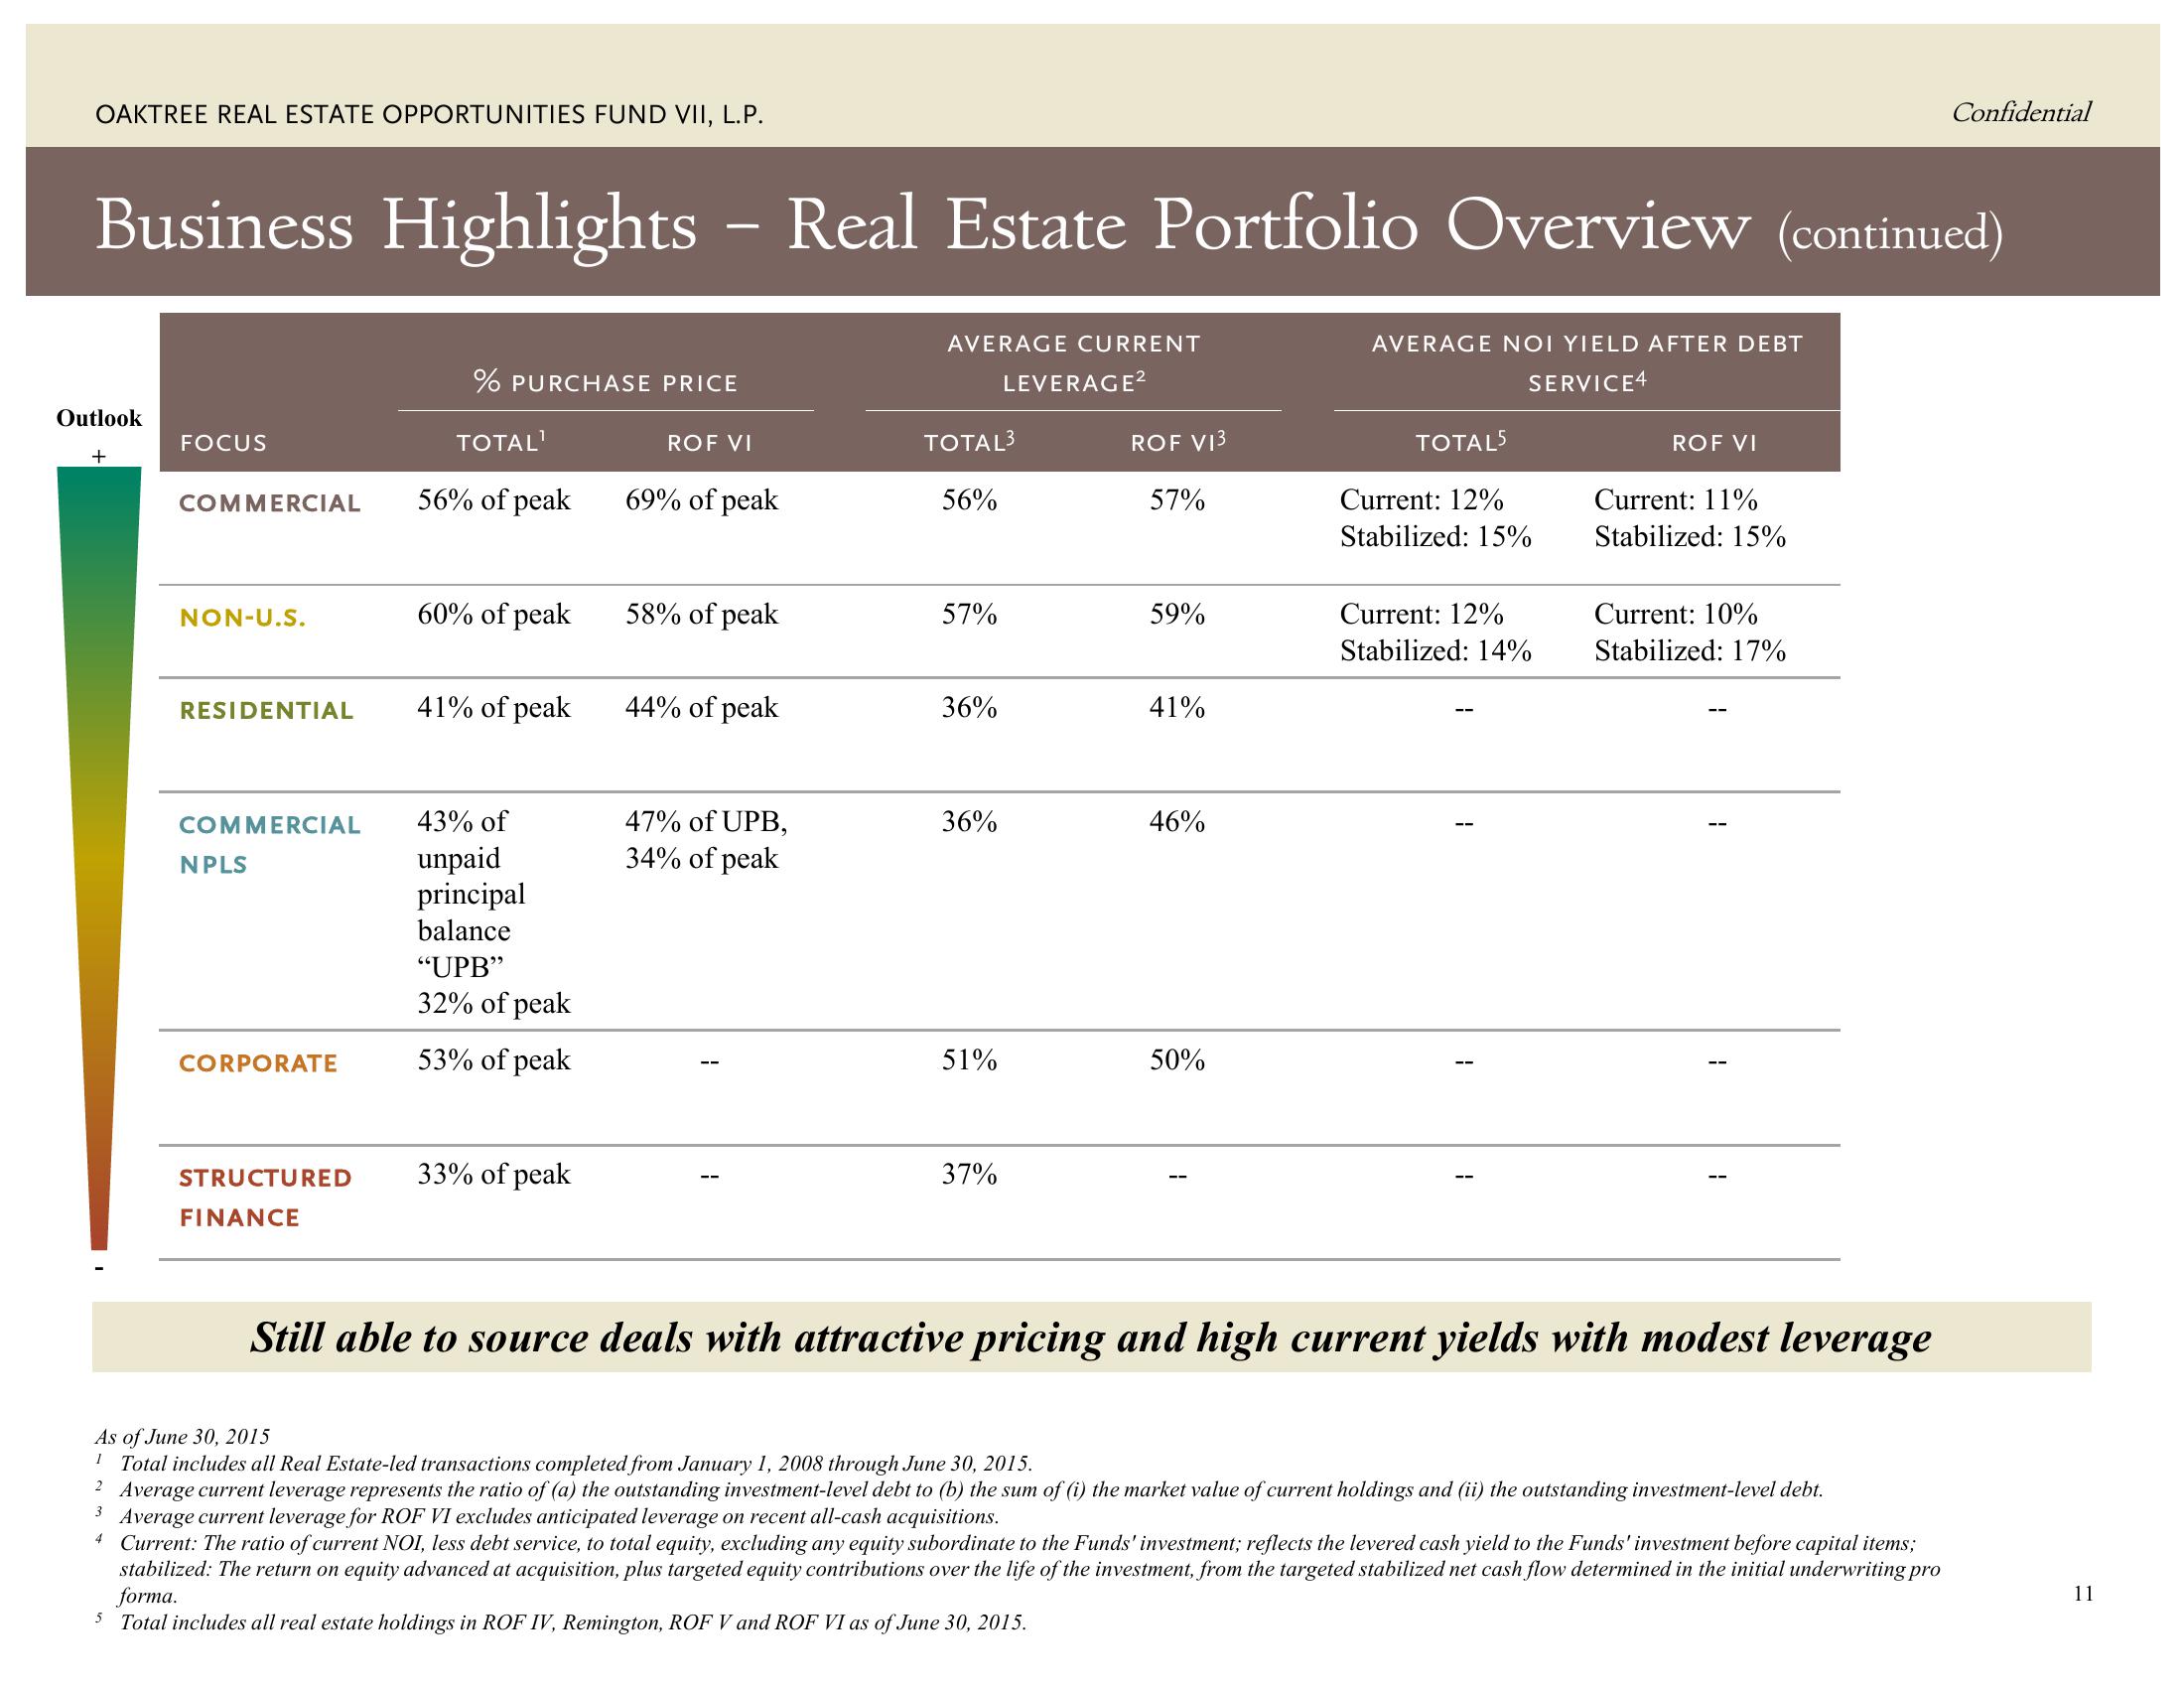
Still able to source deals with attractive pricing and high current yields with modest leverage
As of June 30, 2015
¹ Total includes all Real Estate-led transactions completed from January 1, 2008 through June 30, 2015.
2 Average current leverage represents the ratio of (a) the outstanding investment-level debt to (b) the sum of (i) the market value of current holdings and (ii) the outstanding investment-level debt.
3 Average current leverage for ROF VI excludes anticipated leverage on recent all-cash acquisitions.
Confidential
4 Current: The ratio of current NOI, less debt service, to total equity, excluding any equity subordinate to the Funds' investment; reflects the levered cash yield to the Funds' investment before capital items;
stabilized: The return on equity advanced at acquisition, plus targeted equity contributions over the life of the investment, from the targeted stabilized net cash flow determined in the initial underwriting pro
forma.
5 Total includes all real estate holdings in ROF IV, Remington, ROF V and ROF VI as of June 30, 2015.
11View entire presentation