Capri Holdings Results Presentation Deck
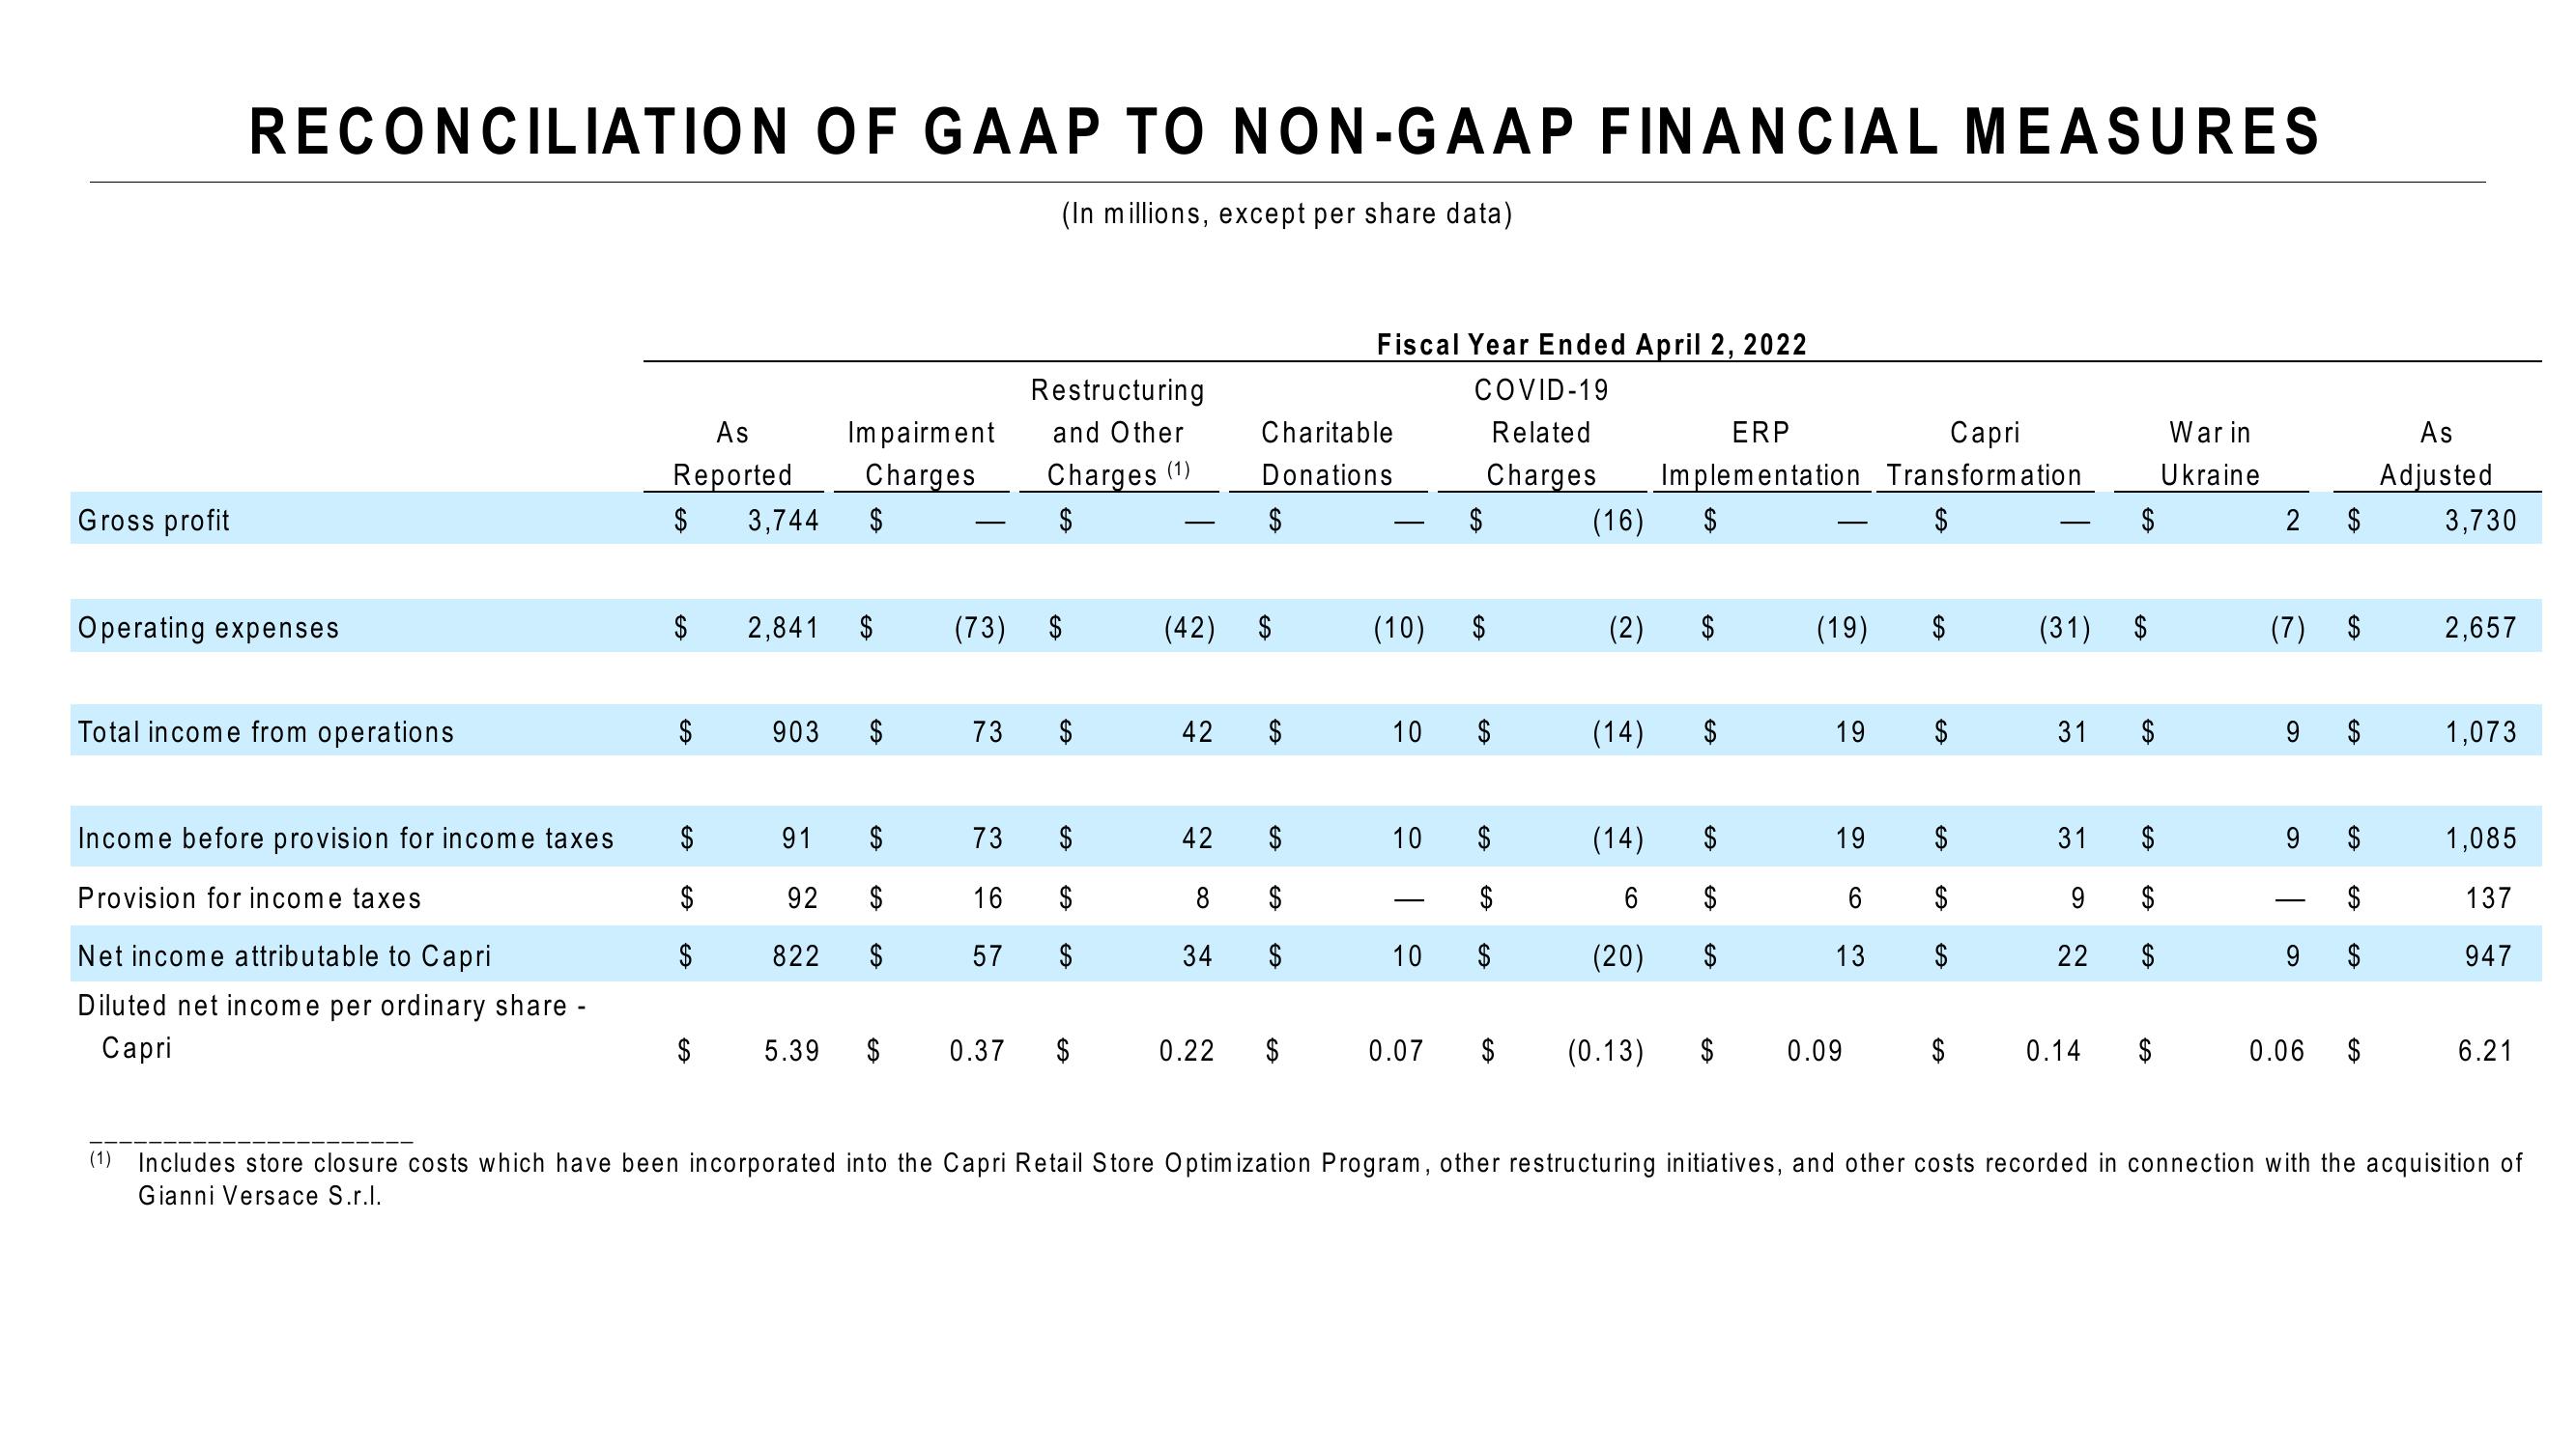
Gross profit
RECONCILIATION OF GAAP TO NON-GAAP FINANCIAL MEASURES
(In millions, except per share data)
Operating expenses
Total income from operations
Income before provision for income taxes
Provision for income taxes
Net income attributable to Capri
Diluted net income per ordinary share -
Capri
As
Reported
$
$
3,744
2,841
903
91
Impairment
Charges
$
5.39
$
$
$
92
$
822 $
$
(73) $
73
Restructuring
and Other
Charges (1)
$
73
16
57
SA
SA
SA
$
0.37 $
Charitable
Donations
(42) $
42 $
42 $
8
34 $
Fiscal Year Ended April 2, 2022
COVID-19
Capri
Related
ERP
Charges Implementation Transformation
(16) $
$
0.22 $
(10)
10
10
10
$
$
0.07 $
(2)
(14)
(14)
6
(20)
(0.13)
$
$
(19)
19
19
6
13
0.09
$
EA
SA
(31) $
$
31 $
31
9
22
0.14
SA
$
$
War in
Ukraine
2 $
(7) $
CO
9
|
S
0.06
GA
GA
CA
LA
$
As
Adjusted
3,730
2,657
1,073
1,085
137
947
6.21
(1) Includes store closure costs which have been incorporated into the Capri Retail Store Optimization Program, other restructuring initiatives, and other costs recorded in connection with the acquisition of
Gianni Versace S.r.l.View entire presentation