Bank of America Investment Banking Pitch Book
Appendix
Review of Base Case Projections - Revenue
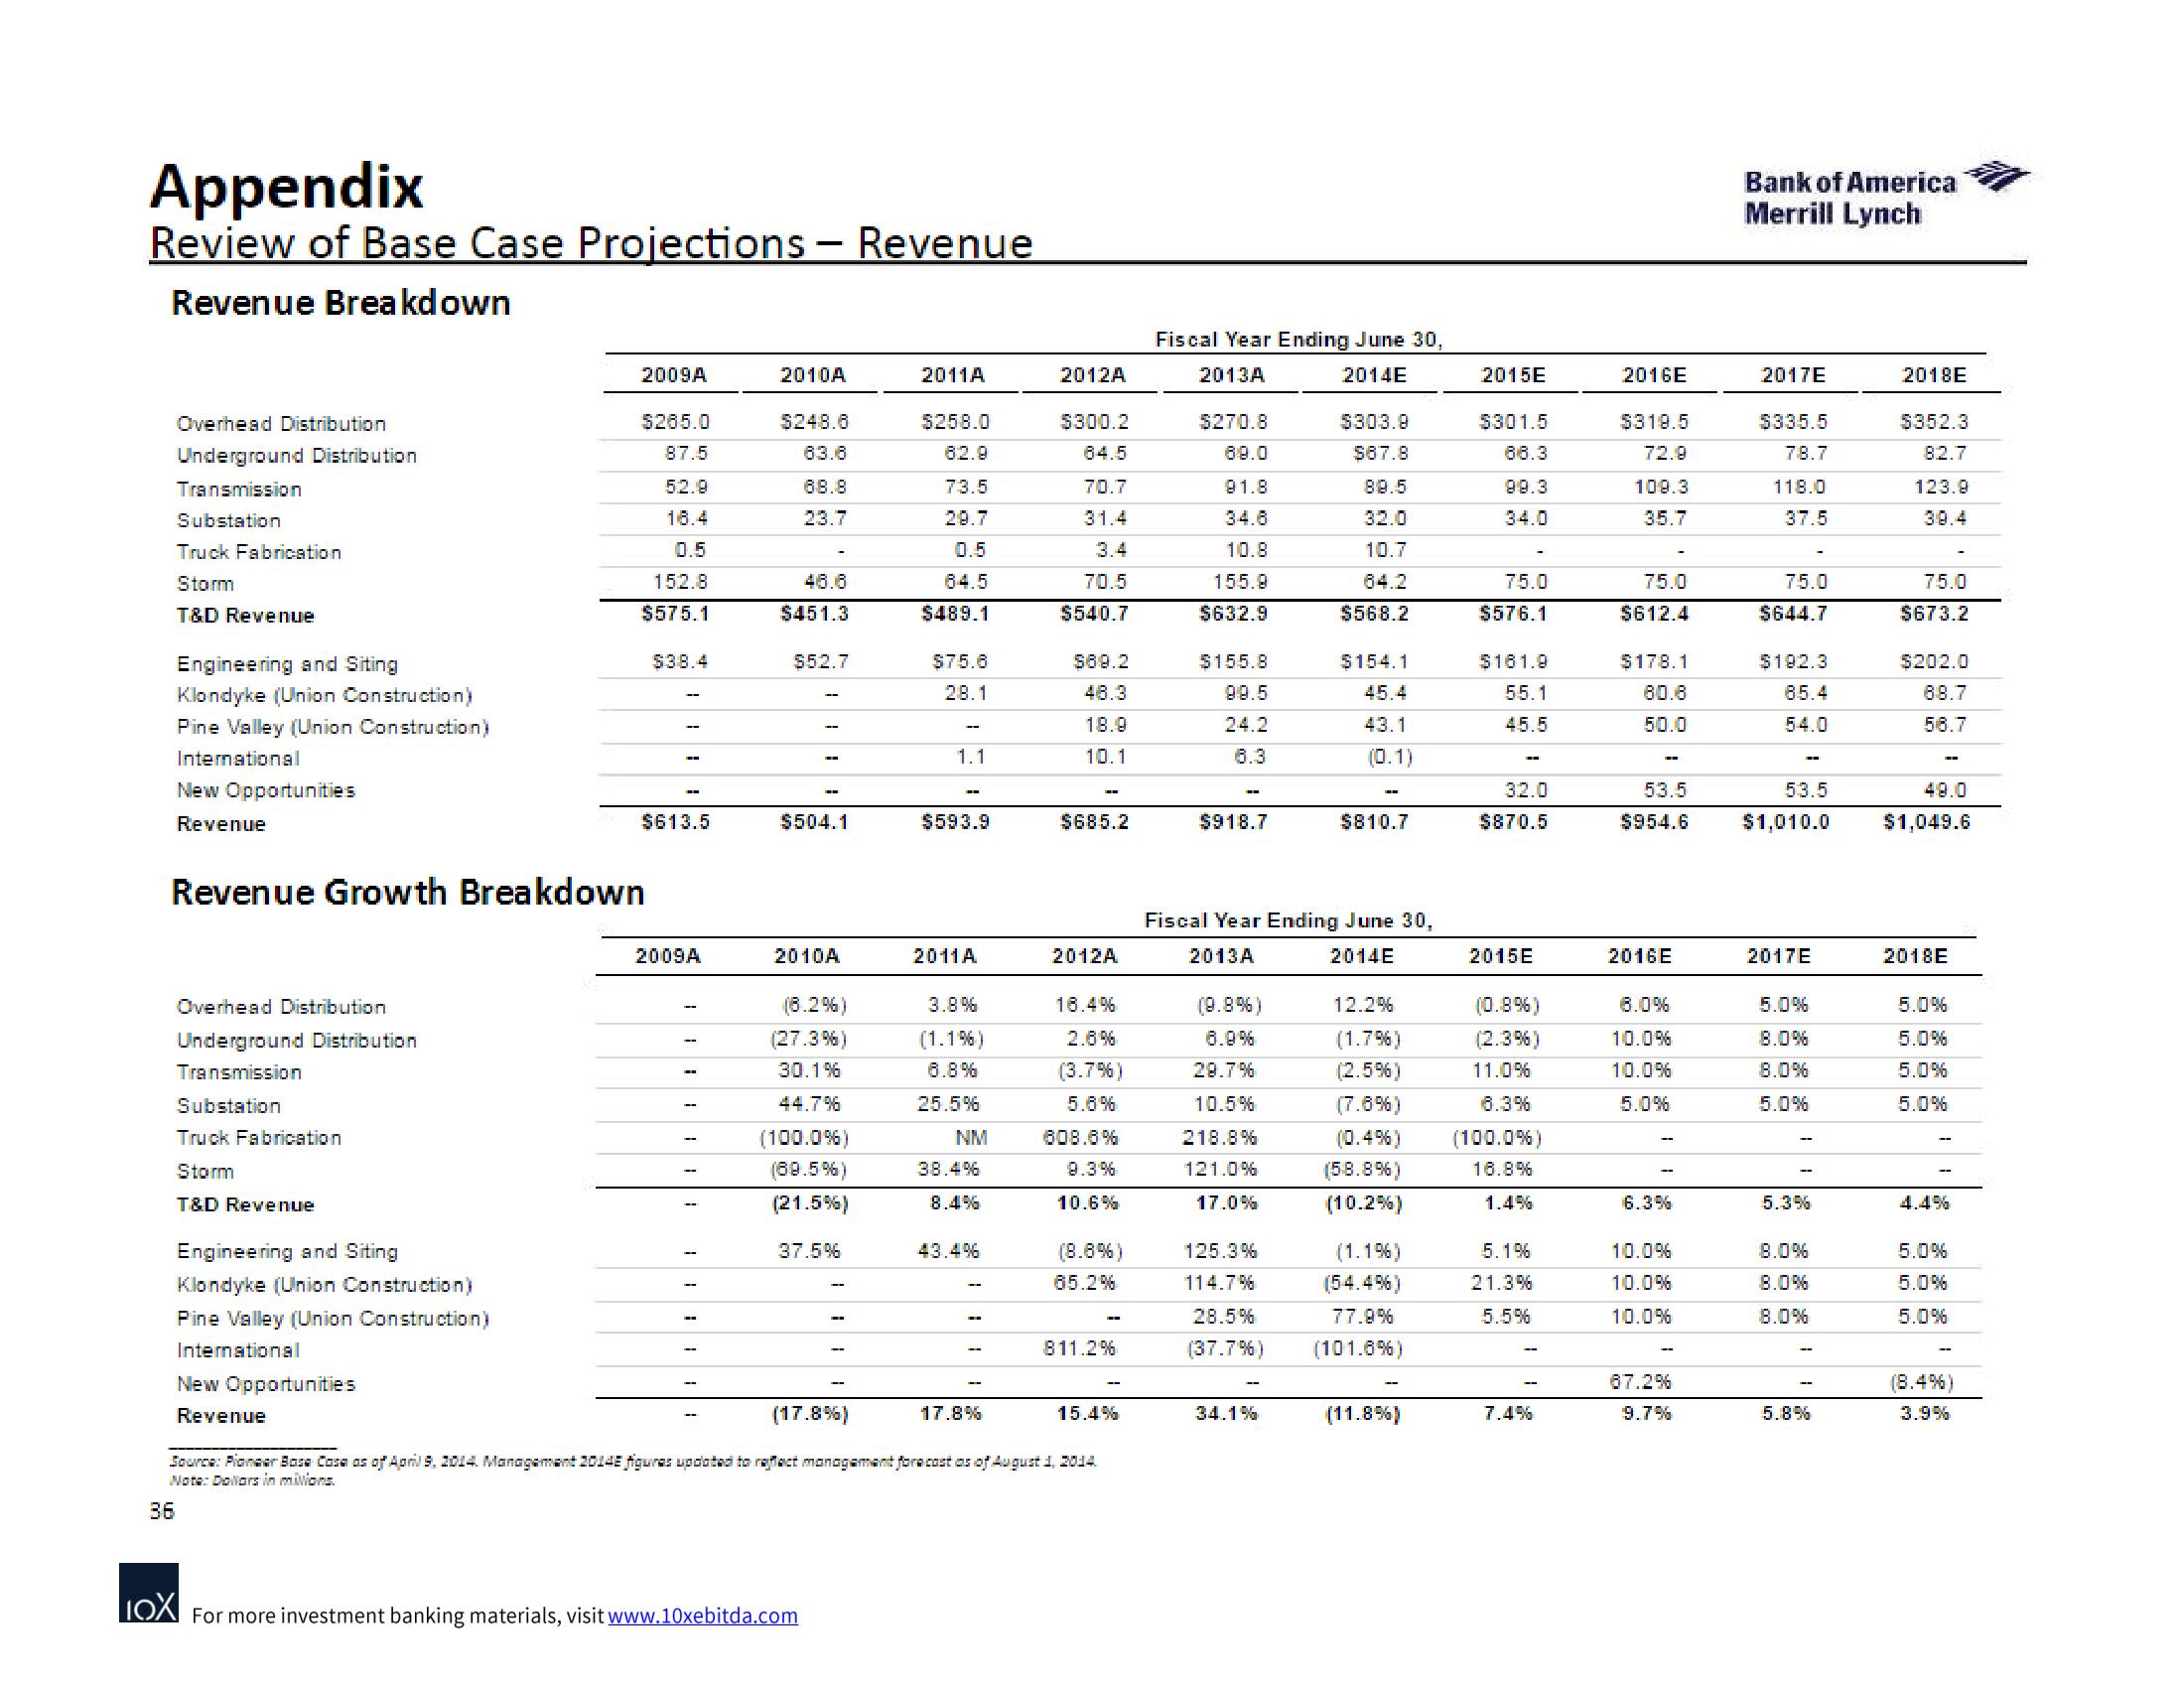
Revenue Breakdown
Overhead Distribution
Underground Distribution
Transmission
Substation
Truck Fabrication
Storm
T&D Revenue
Engineering and Siting
Klondyke (Union Construction)
Pine Valley (Union Construction)
International
New Opportunities
Revenue
Overhead Distribution
Underground Distribution
Transmission
Substation
Revenue Growth Breakdown
Truck Fabrication
Storm
T&D Revenue
Engineering and Siting
Klondyke (Union Construction)
Pine Valley (Union Construction)
International
2009A
$265.0
87.5
52.9
18.4
0.5
152.8
$575.1
New Opportunities
Revenue
$38.4
$613.5
2009A
2010A
$248.0
63.6
88.8
23.7
46.6
$451.3
552.7
$504.1
2010A
(8.2%)
(27.3%)
30.1%
44.7%
(100.0%)
(69.5%)
(21.5%)
37.5%
(17.8%)
2011A
IOX For more investment banking materials, visit www.10xebitda.com
$258.0
82.9
73.5
29.7
0.5
64.5
$489.1
$75.8
28.1
1.1
$593.9
2011 A
3.8%
(1.1%)
6.8%
25.5%
NM
38.4%
8.4%
43.4%
17.8%
2012A
$300.2
64.5
70.7
31.4
3.4
70.5
$540.7
569.2
48.3
18.9
10.1
$685.2
2012A
18.4%
2.6%
(3.7%)
5.0%
608.6%
9.3%
10.6%
(8.8%)
65.2%
811.2%
15.4%
Source: Pioneer Bose Cosa as of April 9. 2014. Management 20148 figuras updated to reflect management forecast as of August 1, 2014.
Note: Dollars in milions.
36
Fiscal Year Ending June 30,
2013A
2014E
$270.8
89.0
91.8
34.8
10.8
155.9
$632.9
$155.8
99.5
24.2
6.3
$918.7
(9.8%)
6.9%
29.7%
10.5%
218.8%
121.0%
17.0%
125.3%
114.7%
28.5%
(37.7%)
$303.9
587.8
89.5
32.0
10.7
64.2
$568.2
Fiscal Year Ending June 30,
2013A
2014E
34.1%
$154.1
45.4
43.1
(0.1)
$810.7
(1.1%)
(54.4%)
77.9%
(101.6%)
2015E
(11.8%)
5301.5
88.3
99.3
34.0
75.0
$576.1
$181.9
55.1
45.5
32.0
$870.5
12.2%
(0.8%)
(1.7%)
(2.3%)
(2.5%)
11.0%
6.3%
(7.6%)
(0.4%) (100.0%)
(58.8%)
16.8%
(10.2%)
1.4%
2015E
5.1%
21.3%
5.5%
7.4%
2016E
$319.5
72.9
109.3
35.7
75.0
$612.4
$178.1
80.8
50.0
53.5
$954.6
2016E
8.0%
10.0%
10.0%
5.0%
-
6.3%
10.0%
10.0%
10.0%
87.2%
9.7%
Bank of America
Merrill Lynch
2017E
$335.5
78.7
118.0
37.5
75.0
$644.7
$192.3
85.4
54.0
53.5
$1,010.0
2017E
5.0%
8.0%
8.0%
5.0%
5.3%
8.0%
8.0%
8.0%
5.8%
2018E
$352.3
82.7
123.9
39.4
75.0
$673.2
$202.0
88.7
58.7
49.0
$1,049.6
2018E
5.0%
5.0%
5.0%
5.0%
4.4%
5.0%
5.0%
5.0%
(8.4%)
3.9%View entire presentation