Informatica Investor Presentation Deck
43
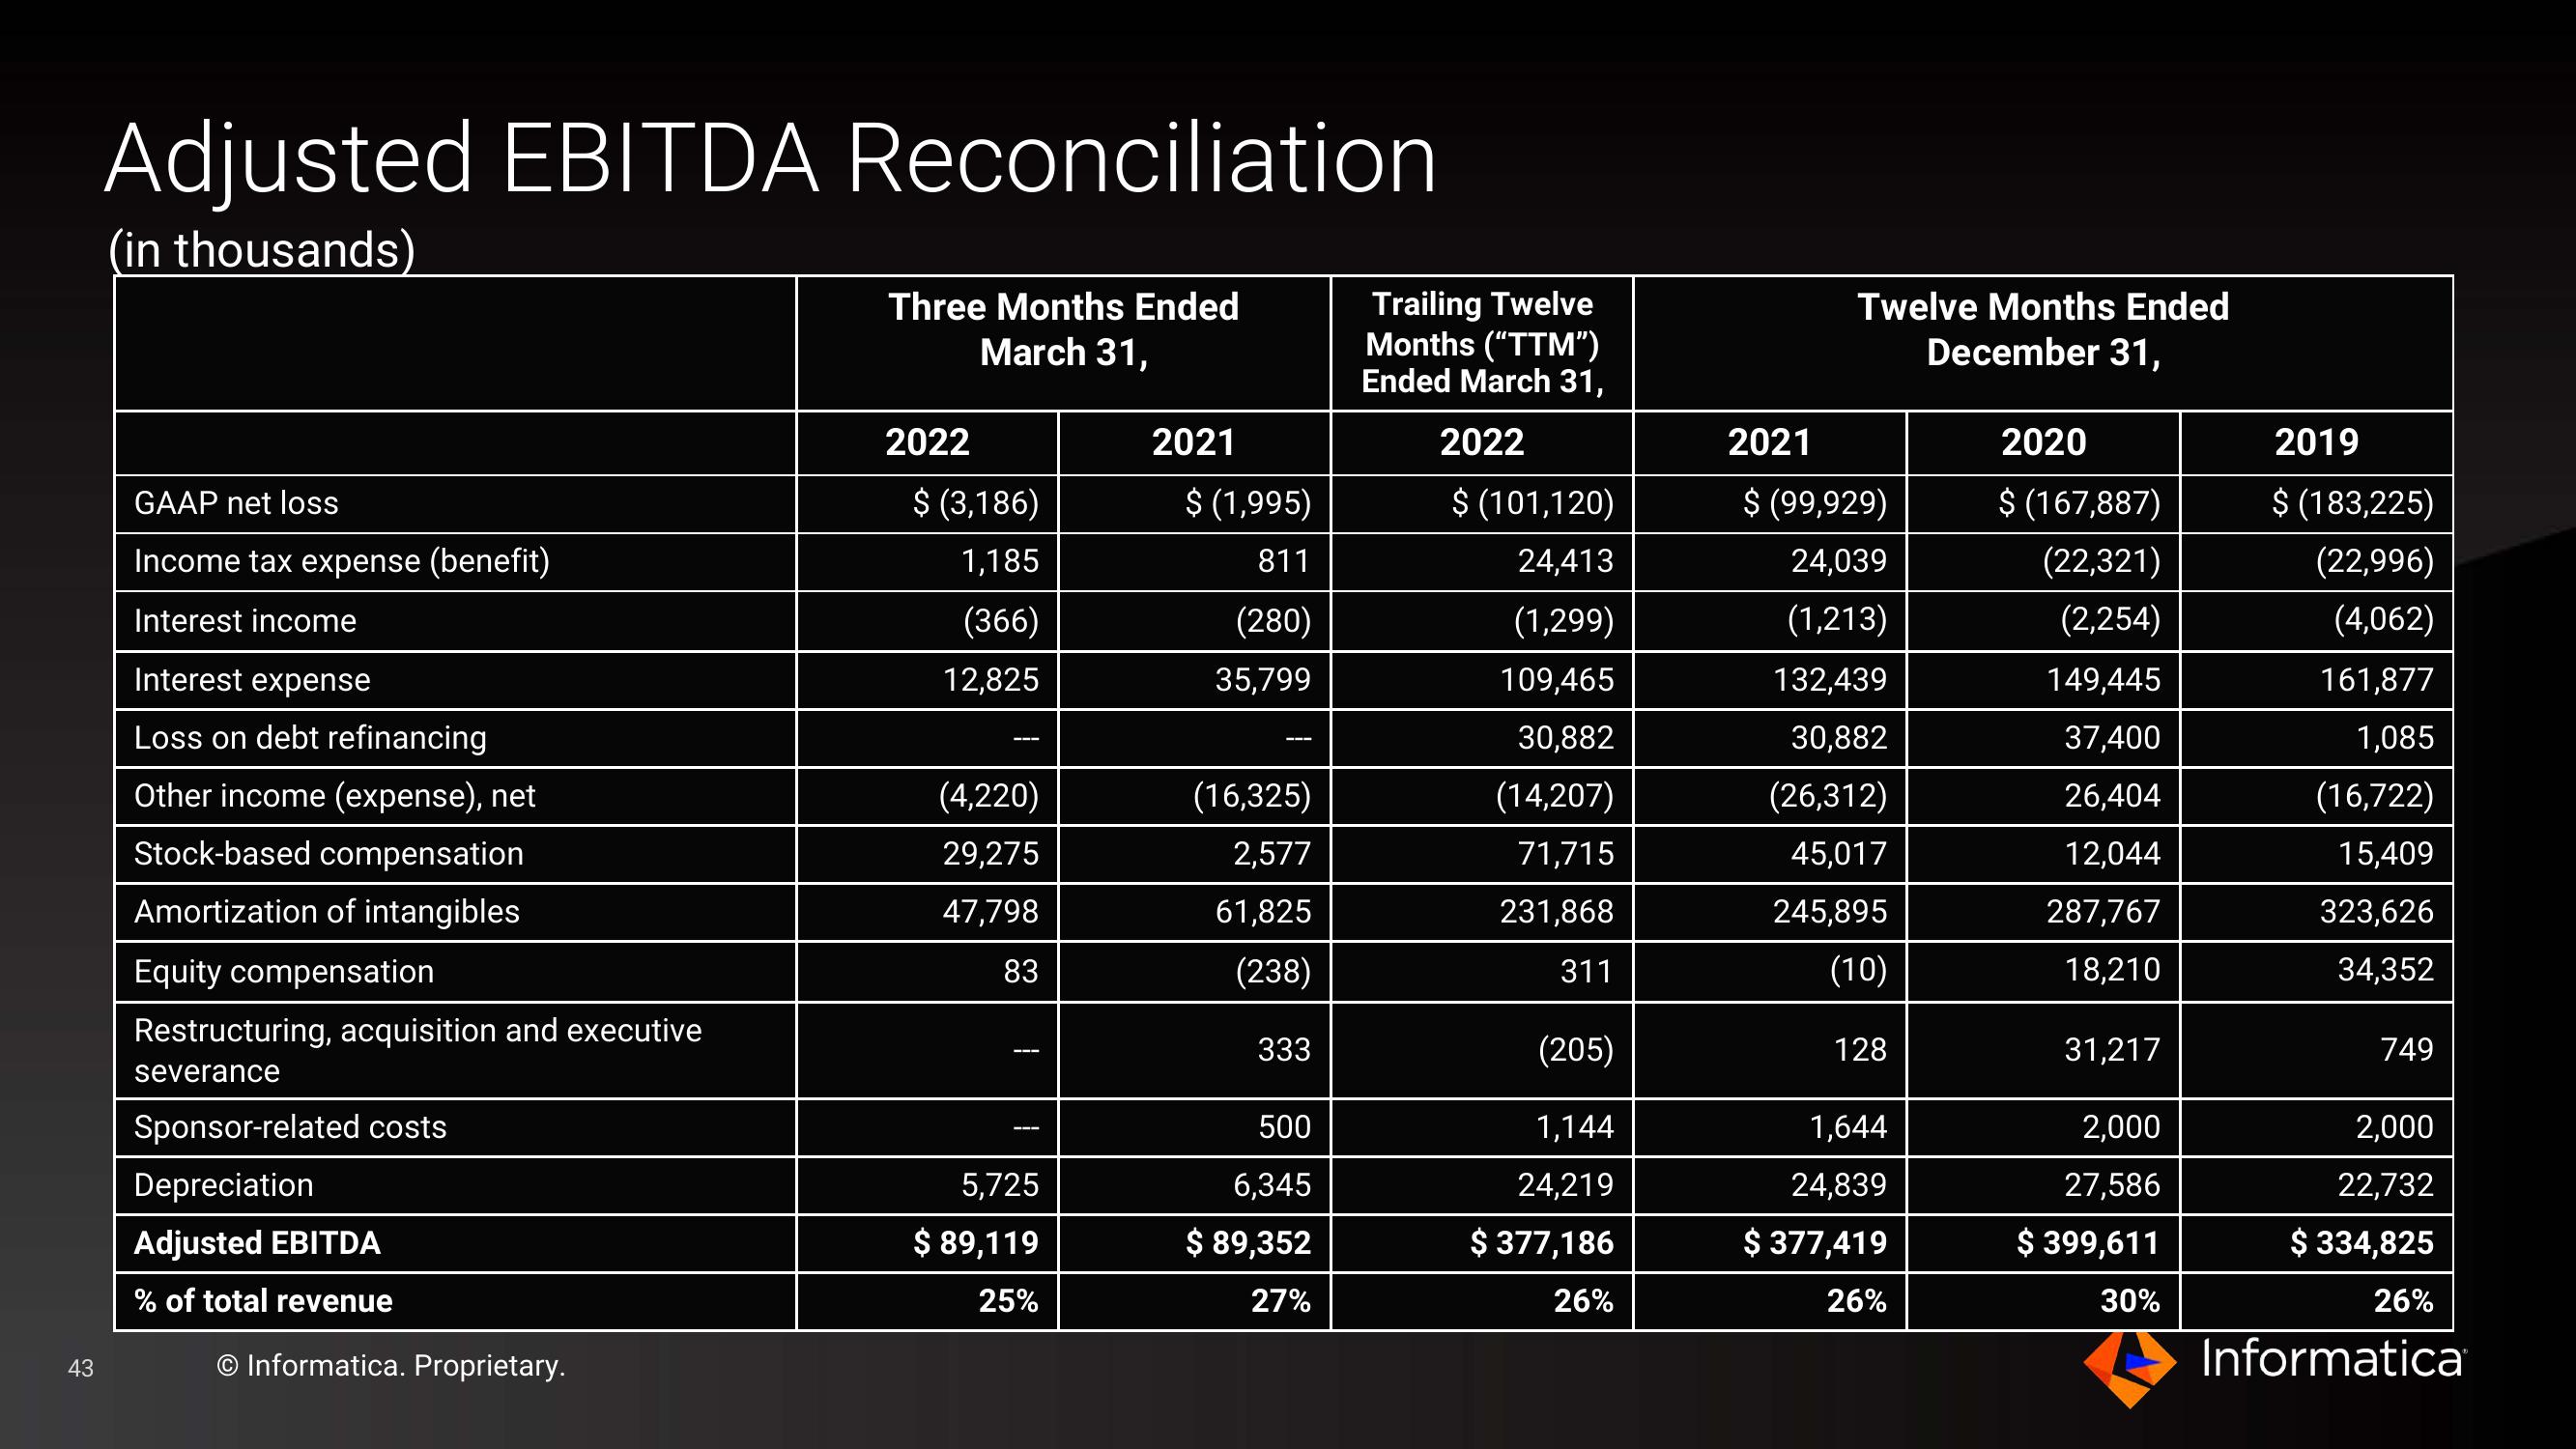
Adjusted EBITDA Reconciliation
(in thousands)
GAAP net loss
Income tax expense (benefit)
Interest income
Interest expense
Loss on debt refinancing
Other income (expense), net
Stock-based compensation
Amortization of intangibles
Equity compensation
Restructuring, acquisition and executive
severance
Sponsor-related costs
Depreciation
Adjusted EBITDA
% of total revenue
Informatica. Proprietary.
Three Months Ended
March 31,
2022
$ (3,186)
1,185
(366)
12,825
(4,220)
29,275
47,798
83
T
I
5,725
$ 89,119
25%
2021
$ (1,995)
811
(280)
35,799
(16,325)
2,577
61,825
(238)
333
500
6,345
$ 89,352
27%
Trailing Twelve
Months ("TTM")
Ended March 31,
2022
$ (101,120)
24,413
(1,299)
109,465
30,882
(14,207)
71,715
231,868
311
(205)
1,144
24,219
$ 377,186
26%
2021
Twelve Months Ended
December 31,
$ (99,929)
24,039
(1,213)
132,439
30,882
(26,312)
45,017
245,895
(10)
128
1,644
24,839
$ 377,419
26%
2020
$ (167,887)
(22,321)
(2,254)
149,445
37,400
26,404
12,044
287,767
18,210
31,217
2,000
27,586
$ 399,611
30%
2019
$ (183,225)
(22,996)
(4,062)
161,877
1,085
(16,722)
15,409
323,626
34,352
749
2,000
22,732
$ 334,825
26%
InformaticaView entire presentation