Nuvei Results Presentation Deck
28
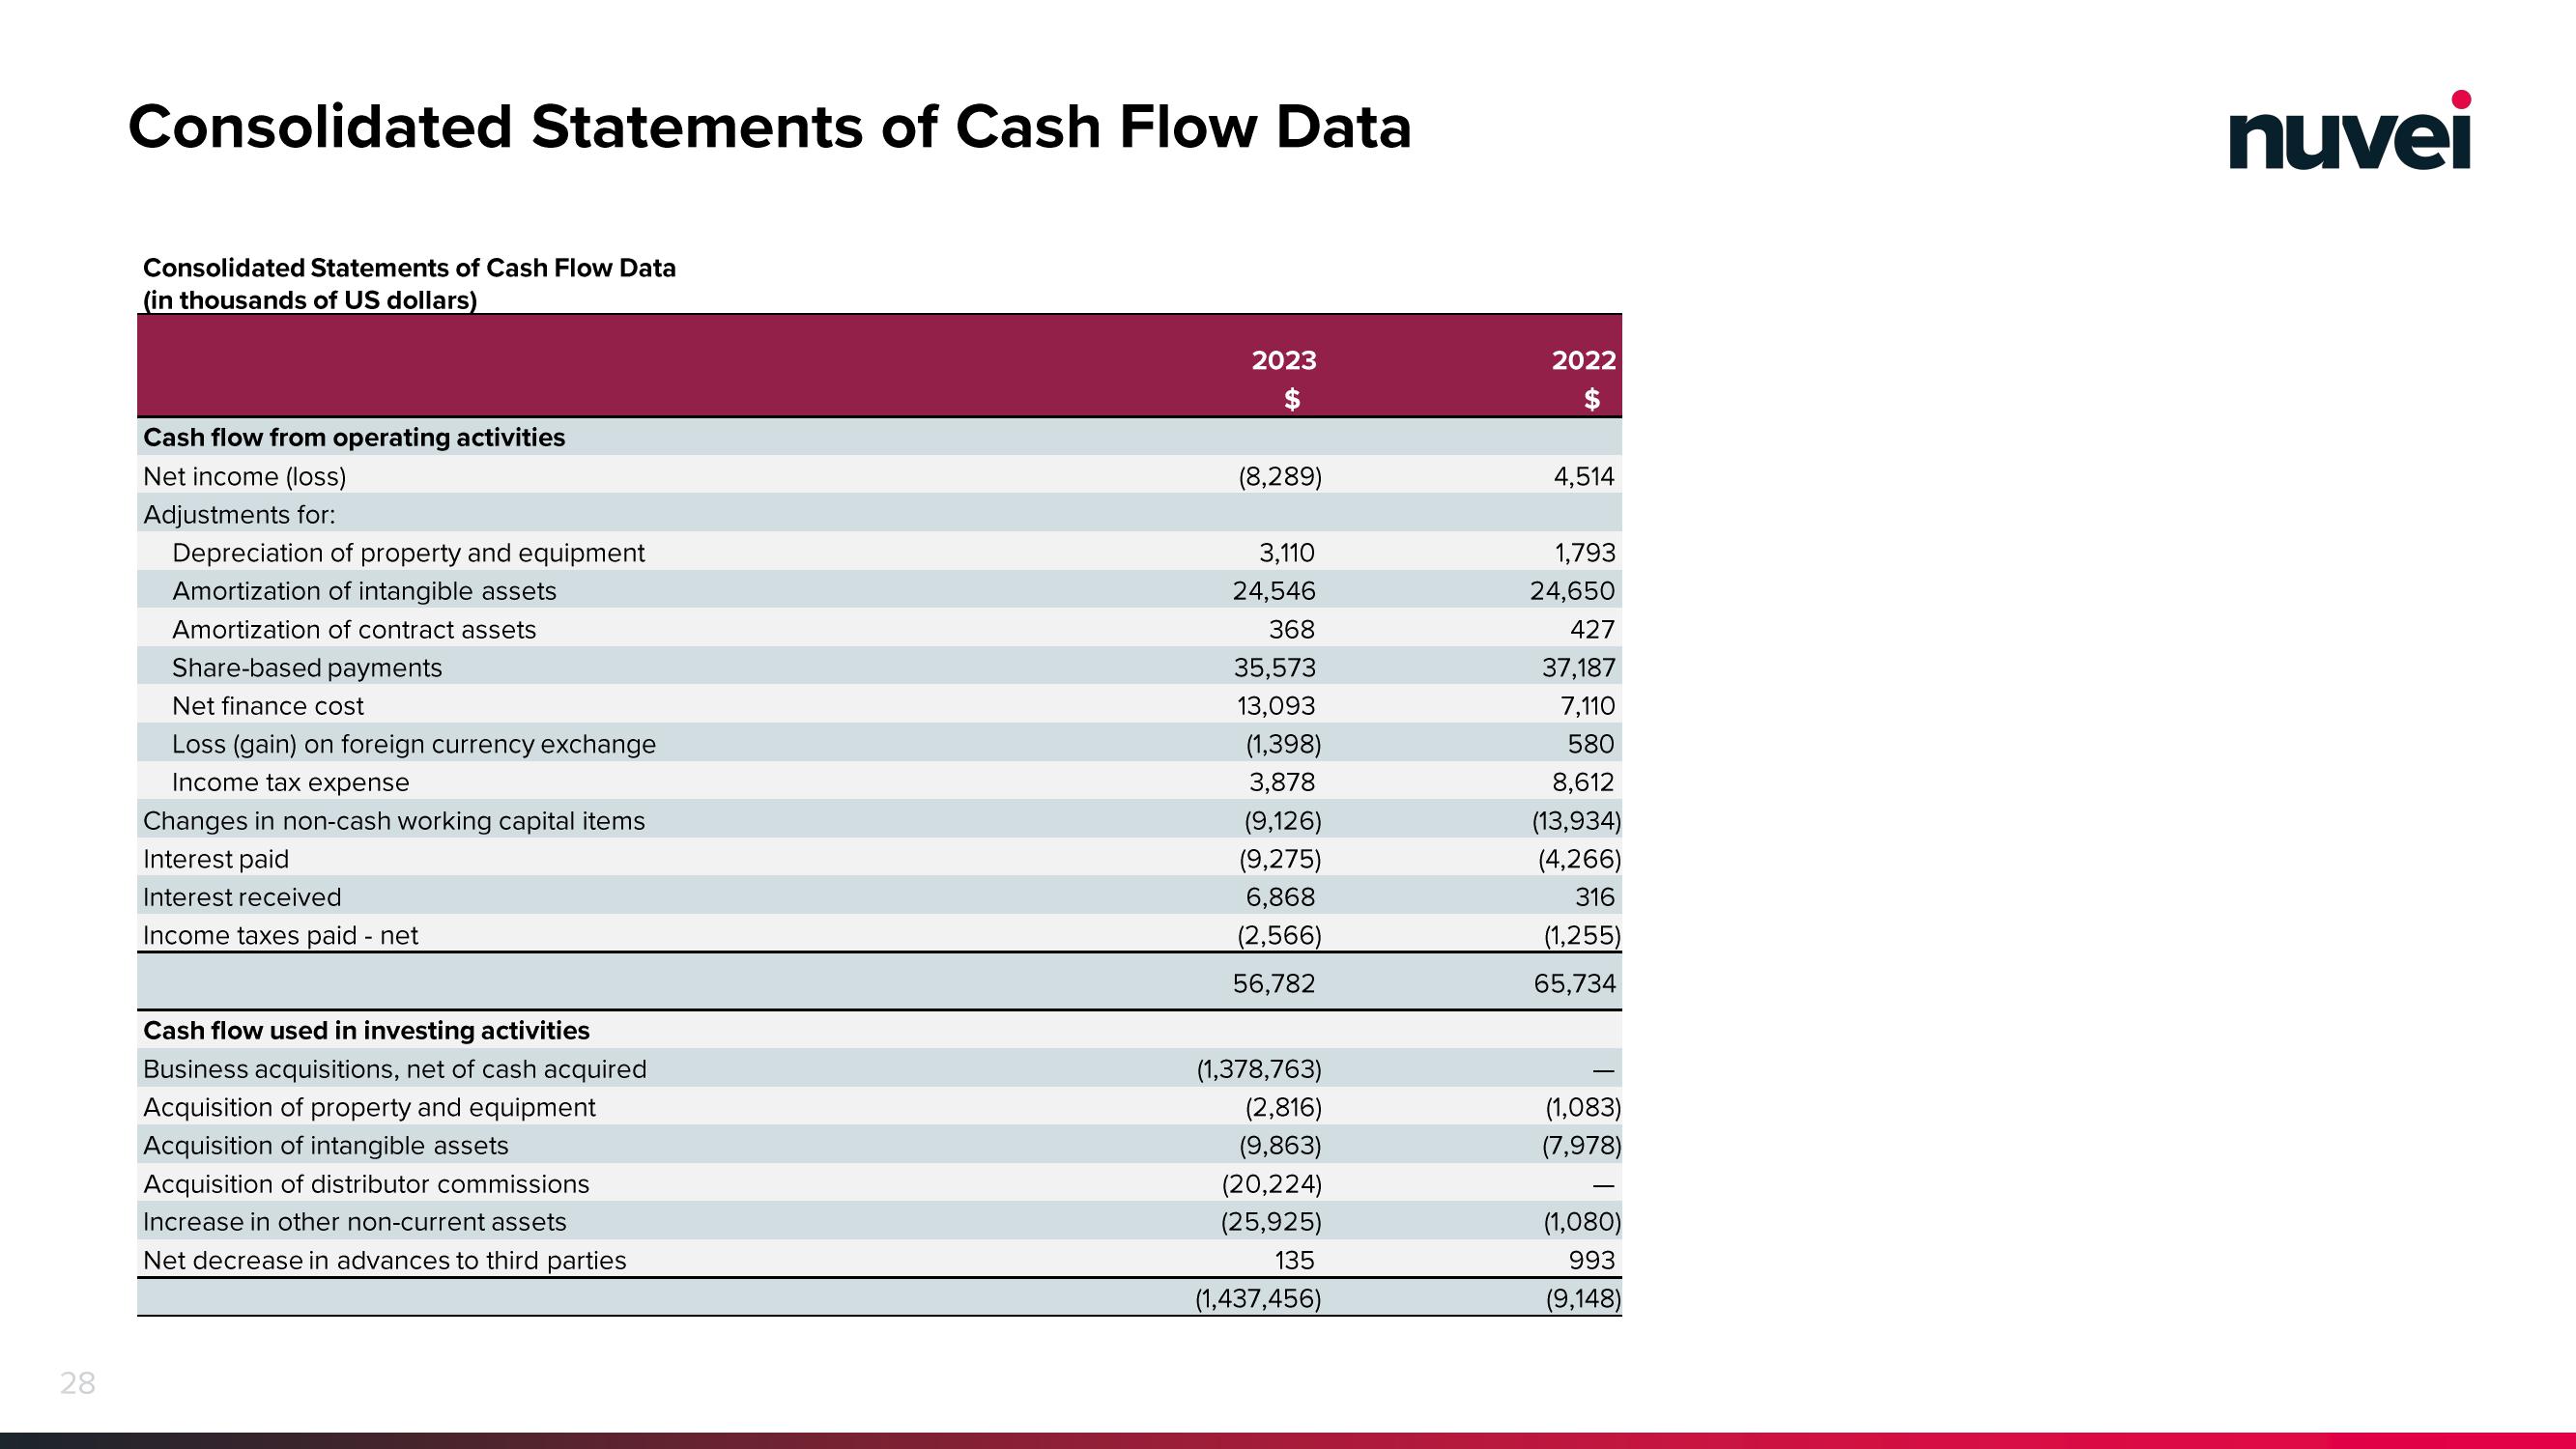
Consolidated Statements of Cash Flow Data
Consolidated Statements of Cash Flow Data
(in thousands of US dollars)
Cash flow from operating activities
Net income (loss)
Adjustments for:
Depreciation of property and equipment
Amortization of intangible assets
Amortization of contract assets
Share-based payments
Net finance cost
Loss (gain) on foreign currency exchange
Income tax expense
Changes in non-cash working capital items
Interest paid
Interest received
Income taxes paid - net
Cash flow used in investing activities
Business acquisitions, net of cash acquired
Acquisition of property and equipment
Acquisition of intangible assets
Acquisition of distributor commissions
Increase in other non-current assets
Net decrease in advances to third parties
2023
$
(8,289)
3,110
24,546
368
35,573
13,093
(1,398)
3,878
(9,126)
(9,275)
6,868
(2,566)
56,782
(1,378,763)
(2,816)
(9,863)
(20,224)
(25,925)
135
(1,437,456)
2022
$
4,514
1,793
24,650
427
37,187
7,110
580
8,612
(13,934)
(4,266)
316
(1,255)
65,734
(1,083)
(7,978)
(1,080)
993
(9,148)
nuveiView entire presentation