CorpAcq SPAC Presentation Deck
32
3A
$451
ΝΑ
$174
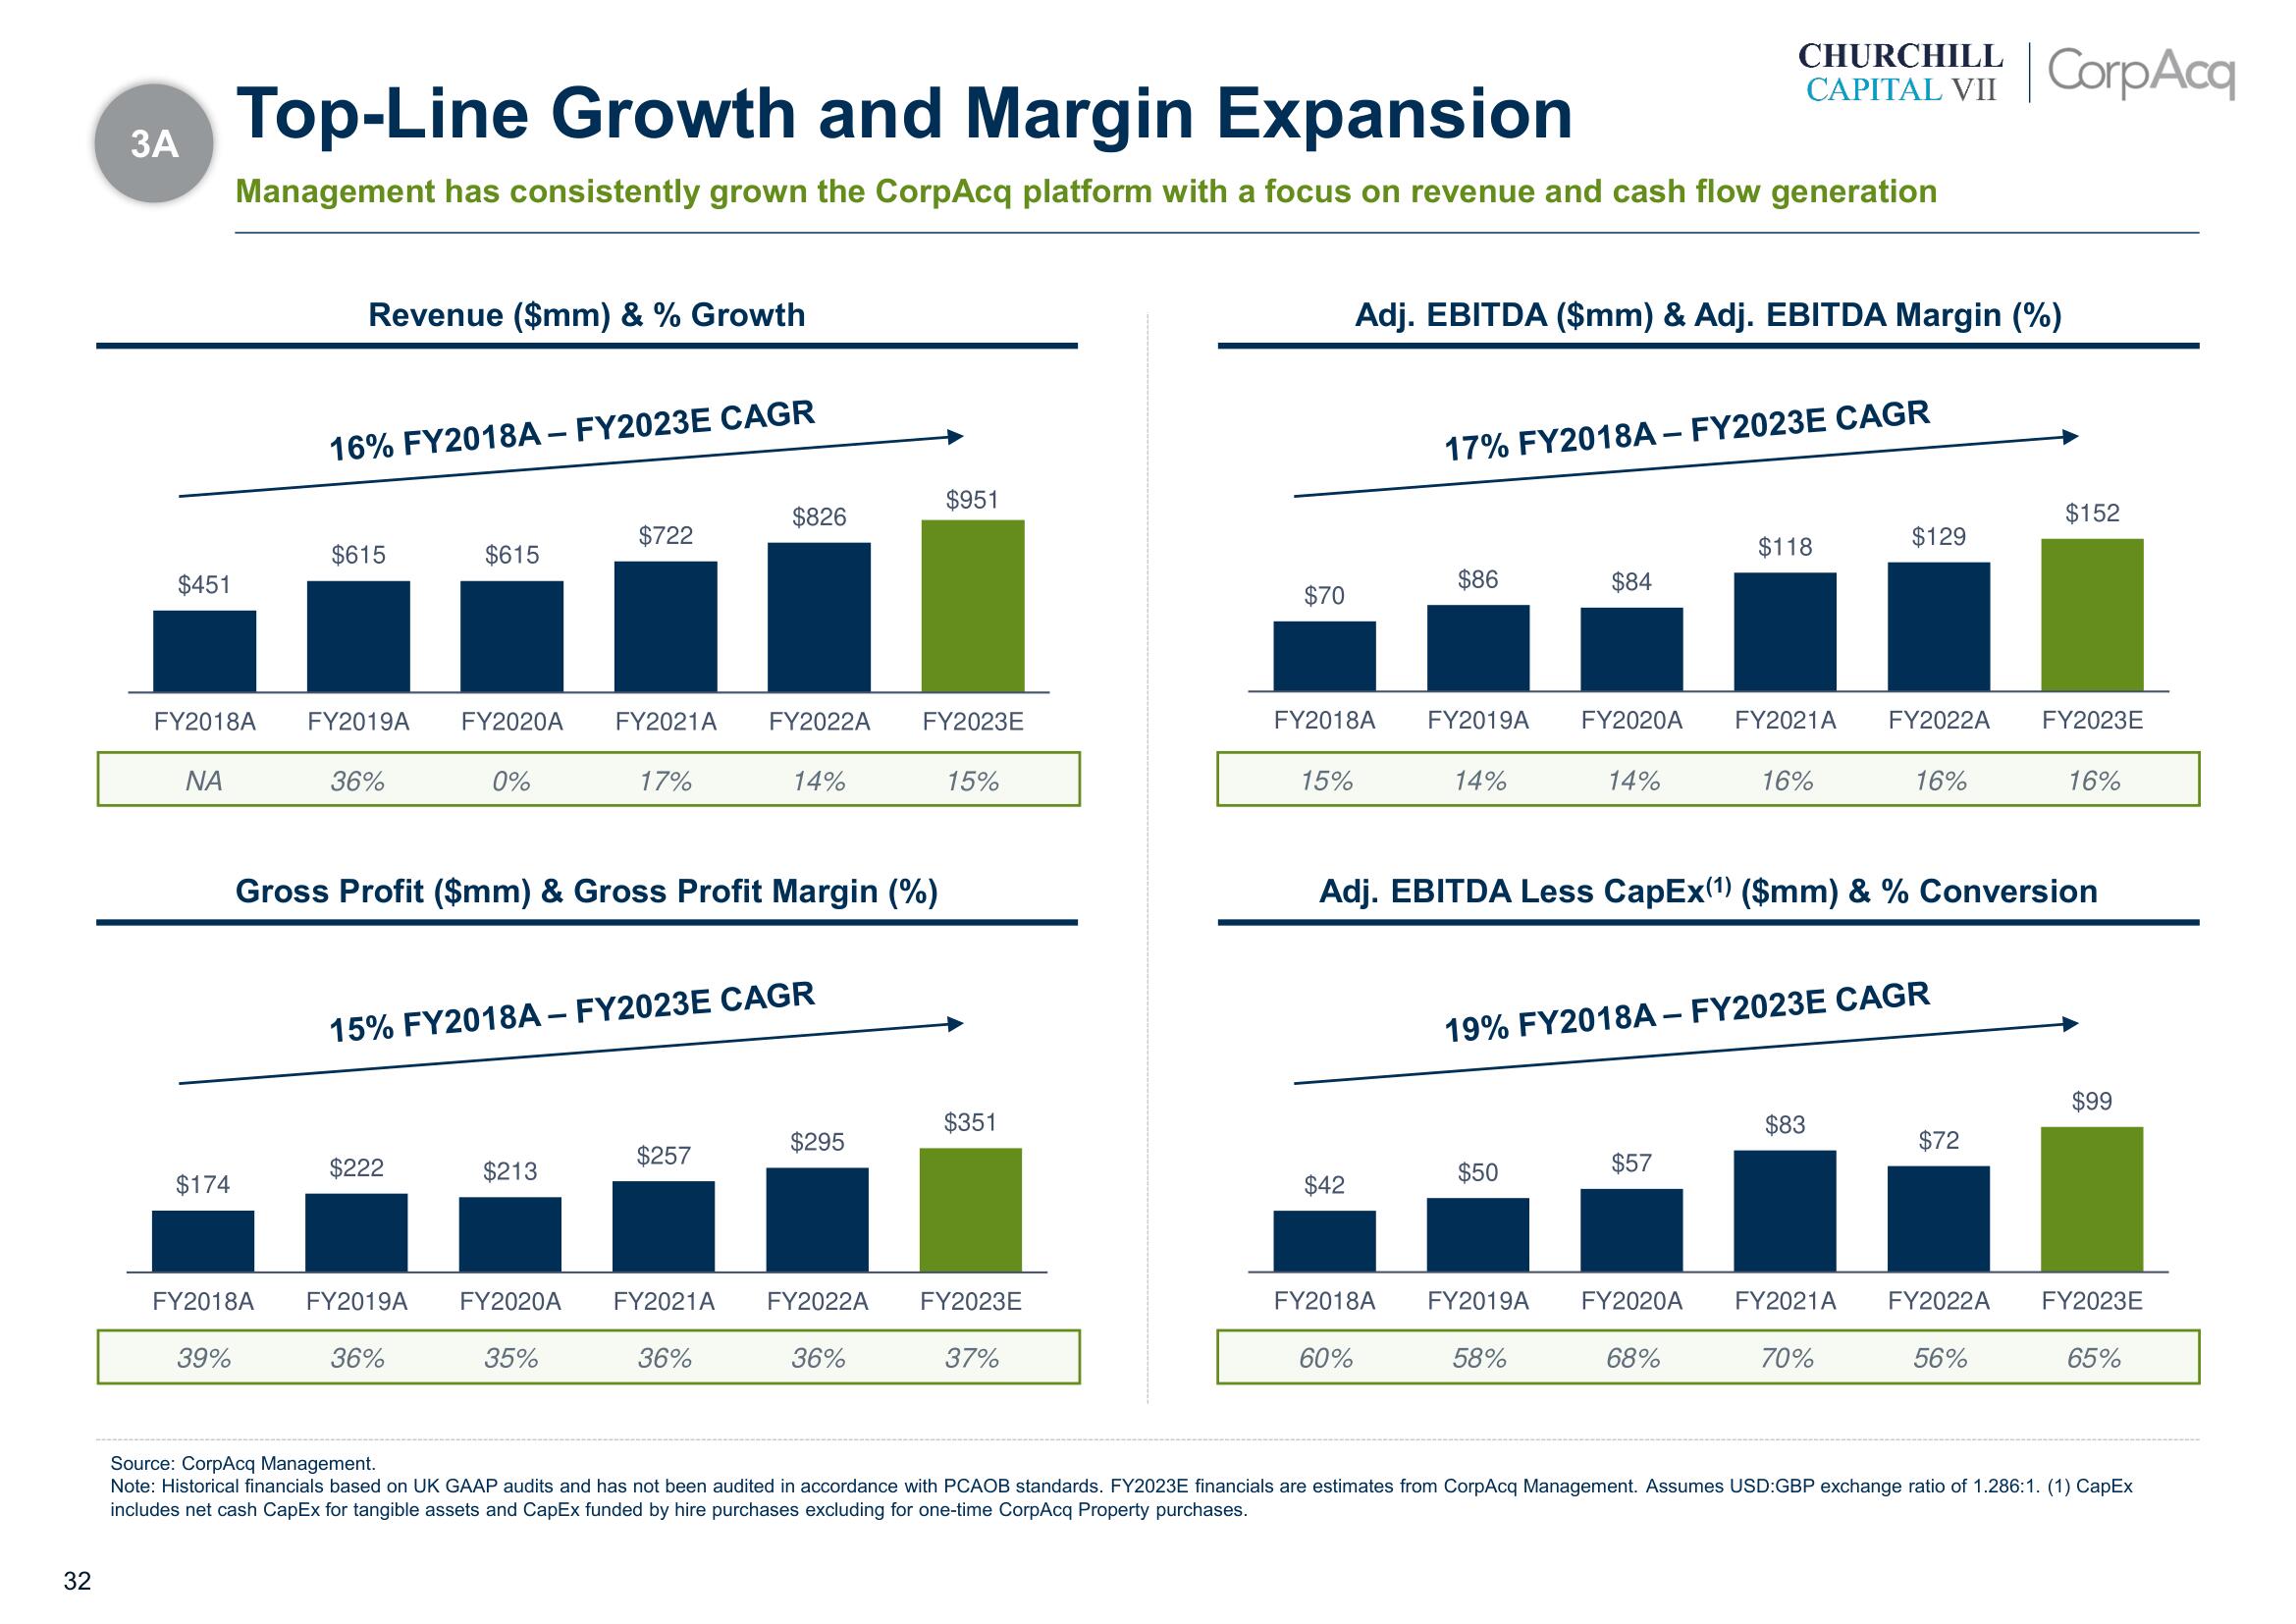
Top-Line Growth and Margin Expansion
Management has consistently grown the CorpAcq platform with a focus on revenue and cash flow generation
Revenue ($mm) & % Growth
39%
16% FY2018A - FY2023E CAGR
$615
FY2018A FY2019A FY2020A FY2021A FY2022A
36%
14%
$615
$222
0%
36%
FY2018A FY2019A FY2020A
$722
Gross Profit ($mm) & Gross Profit Margin (%)
15% FY2018A - FY2023E CAGR
$213
17%
35%
$826
$257
FY2021A
36%
$295
FY2022A
36%
$951
FY2023E
15%
$351
FY2023E
37%
$70
FY2018A
15%
$42
Adj. EBITDA ($mm) & Adj. EBITDA Margin (%)
FY2018A
60%
17% FY2018A - FY2023E CAGR
$86
14%
FY2019A FY2020A FY2021A
CHURCHILL
CAPITAL VII CorpAcq
$84
$50
FY2019A
14%
58%
$118
$57
16%
Adj. EBITDA Less CapEx(1) ($mm) & % Conversion
19% FY2018A - FY2023E CAGR
$129
FY2022A
$83
16%
$72
FY2020A FY2021A FY2022A
68%
70%
$152
56%
FY2023E
16%
$99
FY2023E
65%
Source: CorpAcq Management.
Note: Historical financials based on UK GAAP audits and has not been audited in accordance with PCAOB standards. FY2023E financials are estimates from CorpAcq Management. Assumes USD:GBP exchange ratio of 1.286:1. (1) CapEx
includes net cash CapEx for tangible assets and CapEx funded by hire purchases excluding for one-time CorpAcq Property purchases.View entire presentation