First Foundation Investor Presentation Deck
Non-GAAP Noninterest Expense to Average Assets Ratio
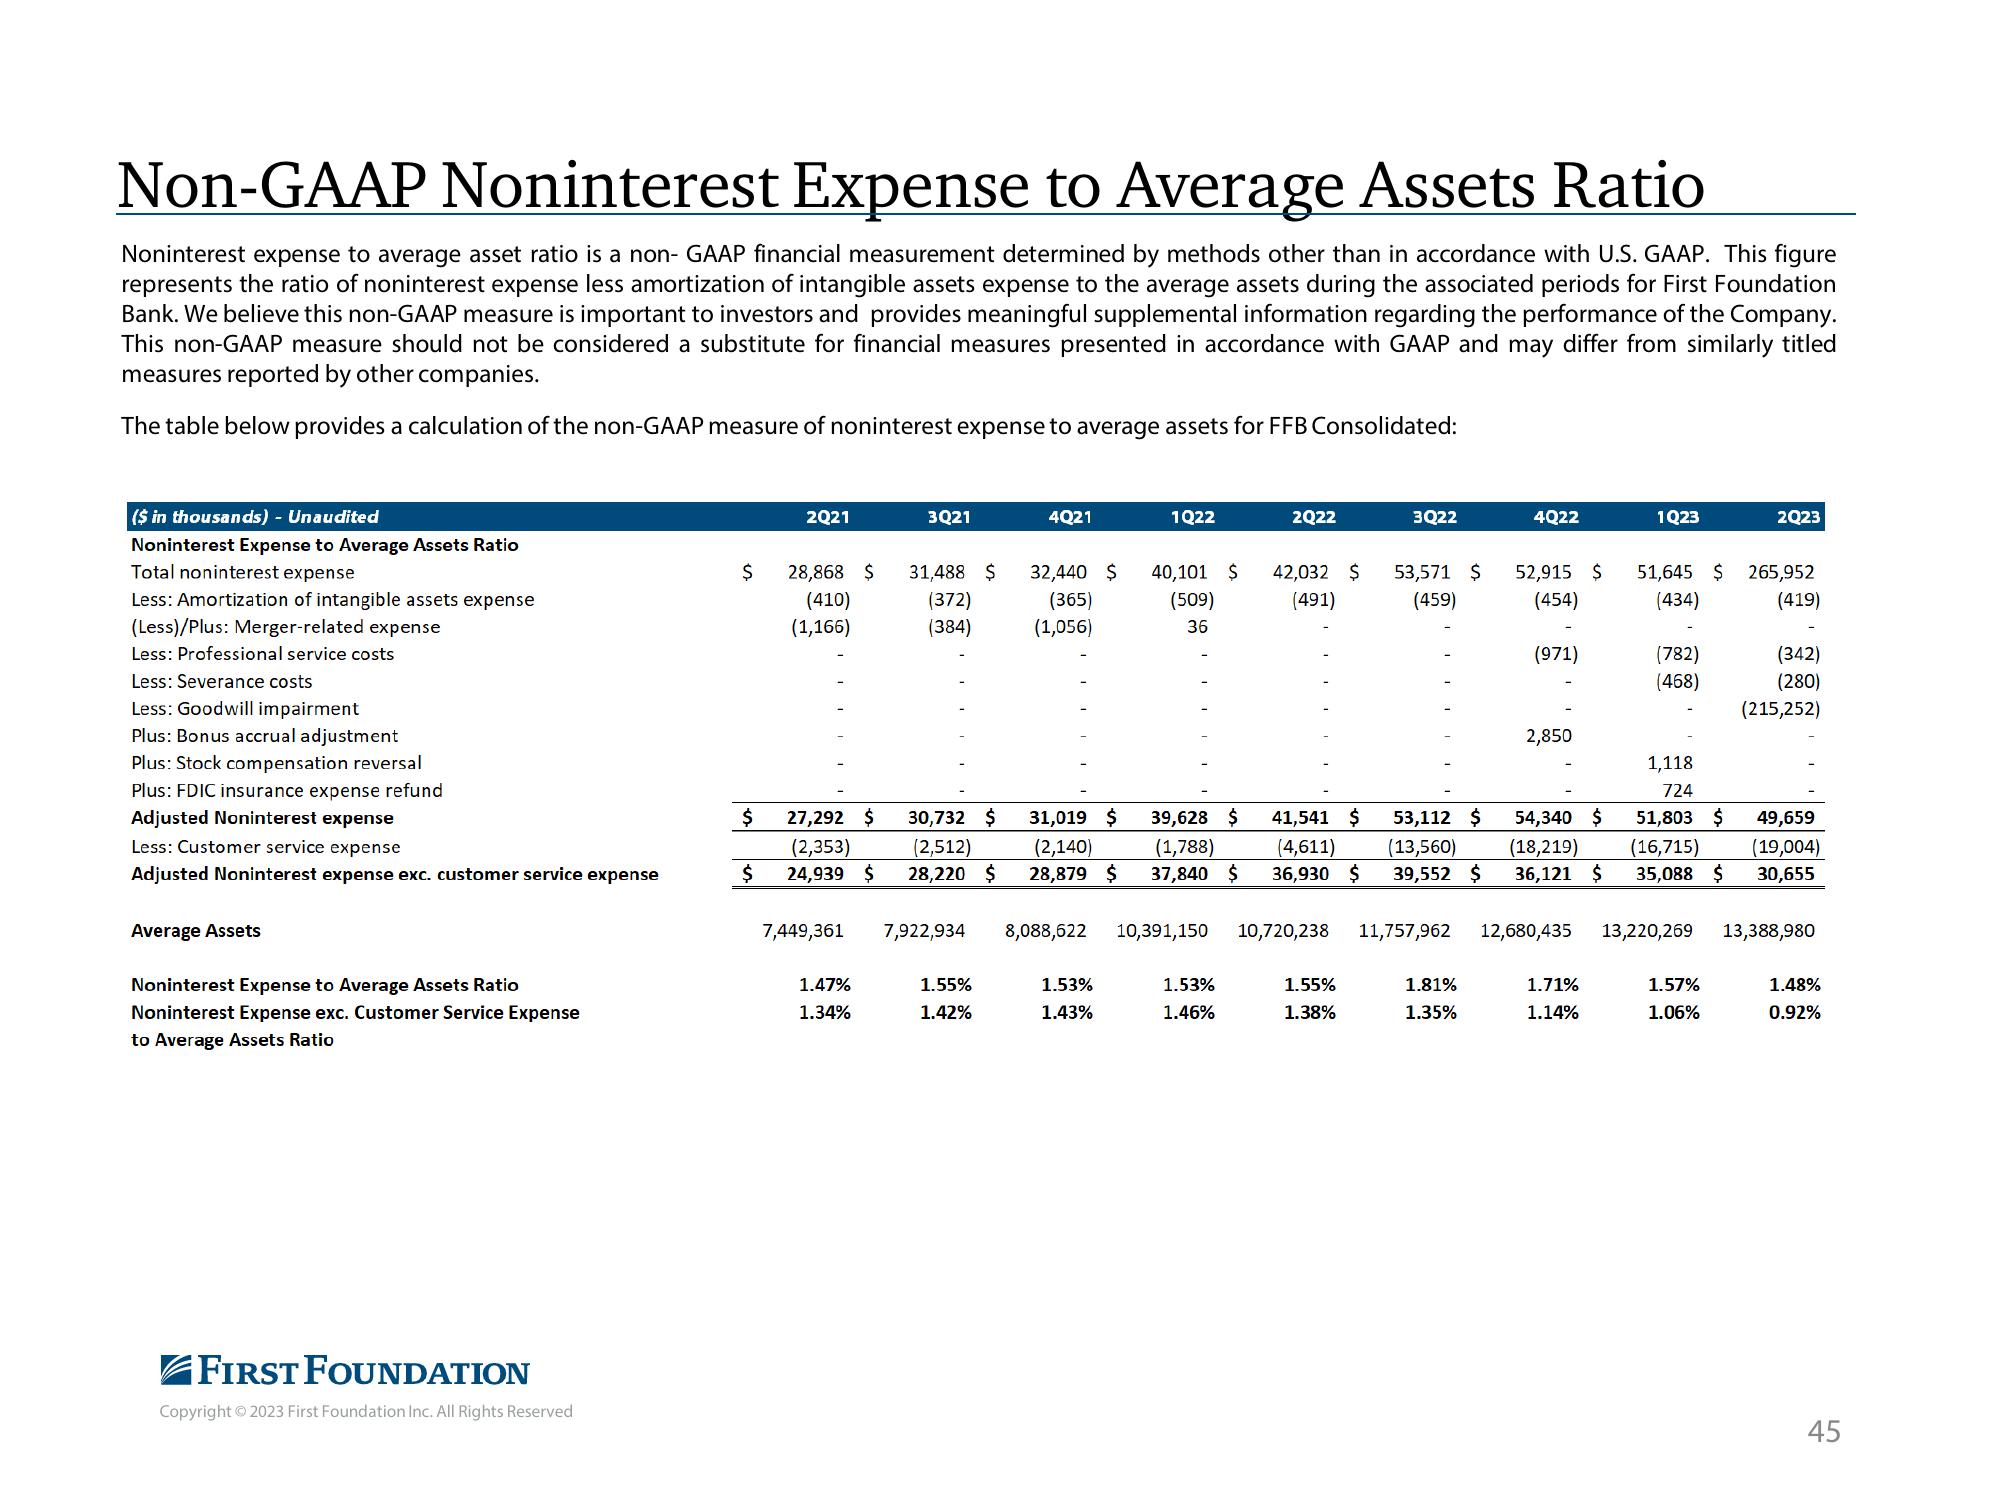
Noninterest expense to average asset ratio is a non- GAAP financial measurement determined by methods other than in accordance with U.S. GAAP. This figure
represents the ratio of noninterest expense less amortization of intangible assets expense to the average assets during the associated periods for First Foundation
Bank. We believe this non-GAAP measure is important to investors and provides meaningful supplemental information regarding the performance of the Company.
This non-GAAP measure should not be considered a substitute for financial measures presented in accordance with GAAP and may differ from similarly titled
measures reported by other companies.
The table below provides a calculation of the non-GAAP measure of noninterest expense to average assets for FFB Consolidated:
($ in thousands) - Unaudited
Noninterest Expense to Average Assets Ratio
Total noninterest expense
Less: Amortization of intangible assets expense
(Less)/Plus: Merger-related expense
Less: Professional service costs
Less: Severance costs
Less: Goodwill impairment
Plus: Bonus accrual adjustment
Plus: Stock compensation reversal
Plus: FDIC insurance expense refund
Adjusted Noninterest expense
Less: Customer service expense
just Noninterest expense exc. ustomer service expense
Average Assets
Noninterest Expense to Average Assets Ratio
Noninterest Expense exc. Customer Service Expense
to Average Assets Ratio
FIRST FOUNDATION
Copyright © 2023 First Foundation Inc. All Rights Reserved
$
$
2021
28,868 $
(410)
(1,166)
27,292 $
(2,353)
$ 24,93 $
7,449,361
1.47%
1.34%
3Q21
31,488 $
(372)
(384)
30,732 $
(2,512)
7,922,934
1.55%
1.42%
$
4Q21
32,440 $
(365)
(1,056)
31,019 $
(2,140)
28,879 $
1Q22
1.53%
1.43%
40,101 $
(509)
36
2Q22
39,628 $ 41,541 $
(1,788) (4,611)
37,840 $ 36,930 $
1.53%
1.46%
42,032 $ 53,571 $
(491)
(459)
3Q22
8,088,622 10,391,150 10,720,238 11,757,962
1.55%
1.38%
53,112 $
(13,560)
9,55 $
1.81%
1.35%
4Q22
52,915 $
(454)
(971)
2,850
54,340 $
(18,219)
$
1.71%
1.14%
1Q23
51,645 $ 265,952
(434)
(419)
(782)
(468)
1,118
724
51,803 $
(16,715)
35,088 $
12,680,435 13,220,269
2023
1.57%
1.06%
(342)
(280)
(215,252)
49,659
(19,004)
30
13,388,980
1.48%
0.92%
45View entire presentation