GMS Results Presentation Deck
GMS-Q2 FY24 at a Glance
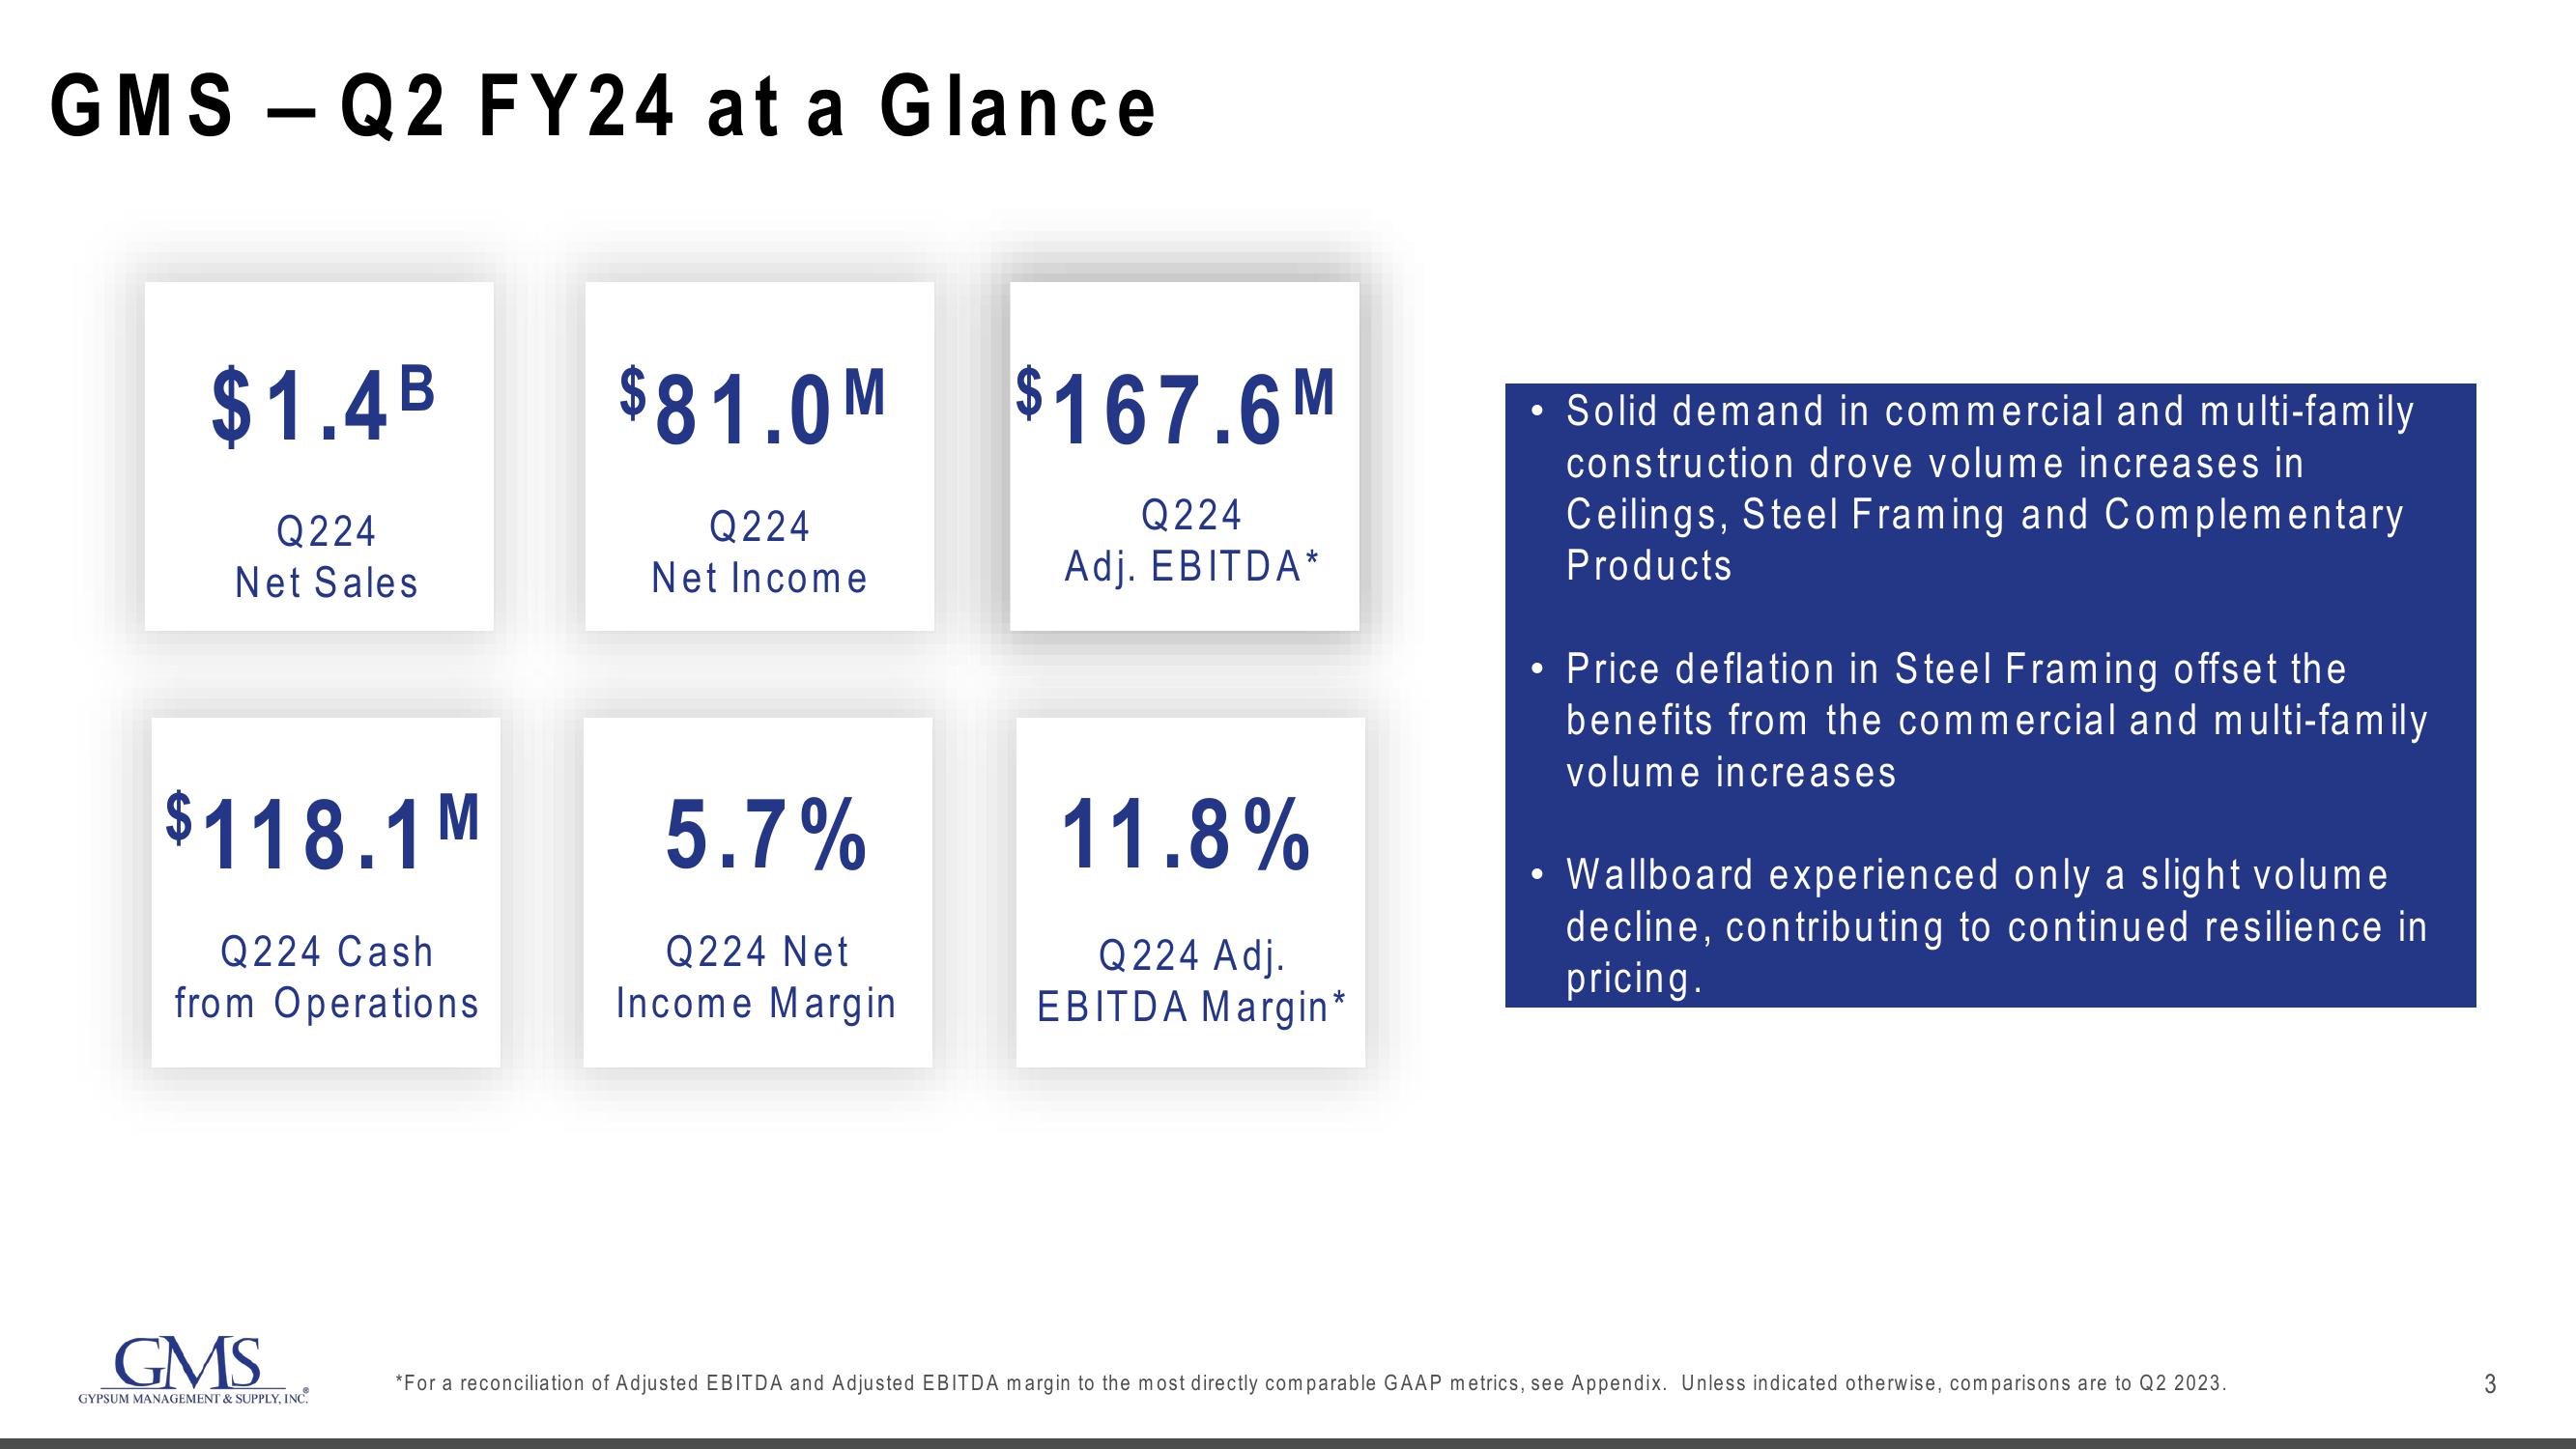
$1.4B
Q224
Net Sales
$118.1 M
Q224 Cash
from Operations
GMS
GYPSUM MANAGEMENT & SUPPLY, INC.
$81.0M
Q224
Net Income
5.7%
Q224 Net
Income Margin
$167.6M
Q224
Adj. EBITDA*
11.8%
Q224 Adj.
EBITDA Margin*
●
●
Solid demand in commercial and multi-family
construction drove volume increases in
Ceilings, Steel Framing and Complementary
Products
Price deflation in Steel Framing offset the
benefits from the commercial and multi-family
volume increases
Wallboard experienced only a slight volume
decline, contributing to continued resilience in
pricing.
*For a reconciliation of Adjusted EBITDA and Adjusted EBITDA margin to the most directly comparable GAAP metrics, see Appendix. Unless indicated otherwise, comparisons are to Q2 2023.
3View entire presentation