Oatly Results Presentation Deck
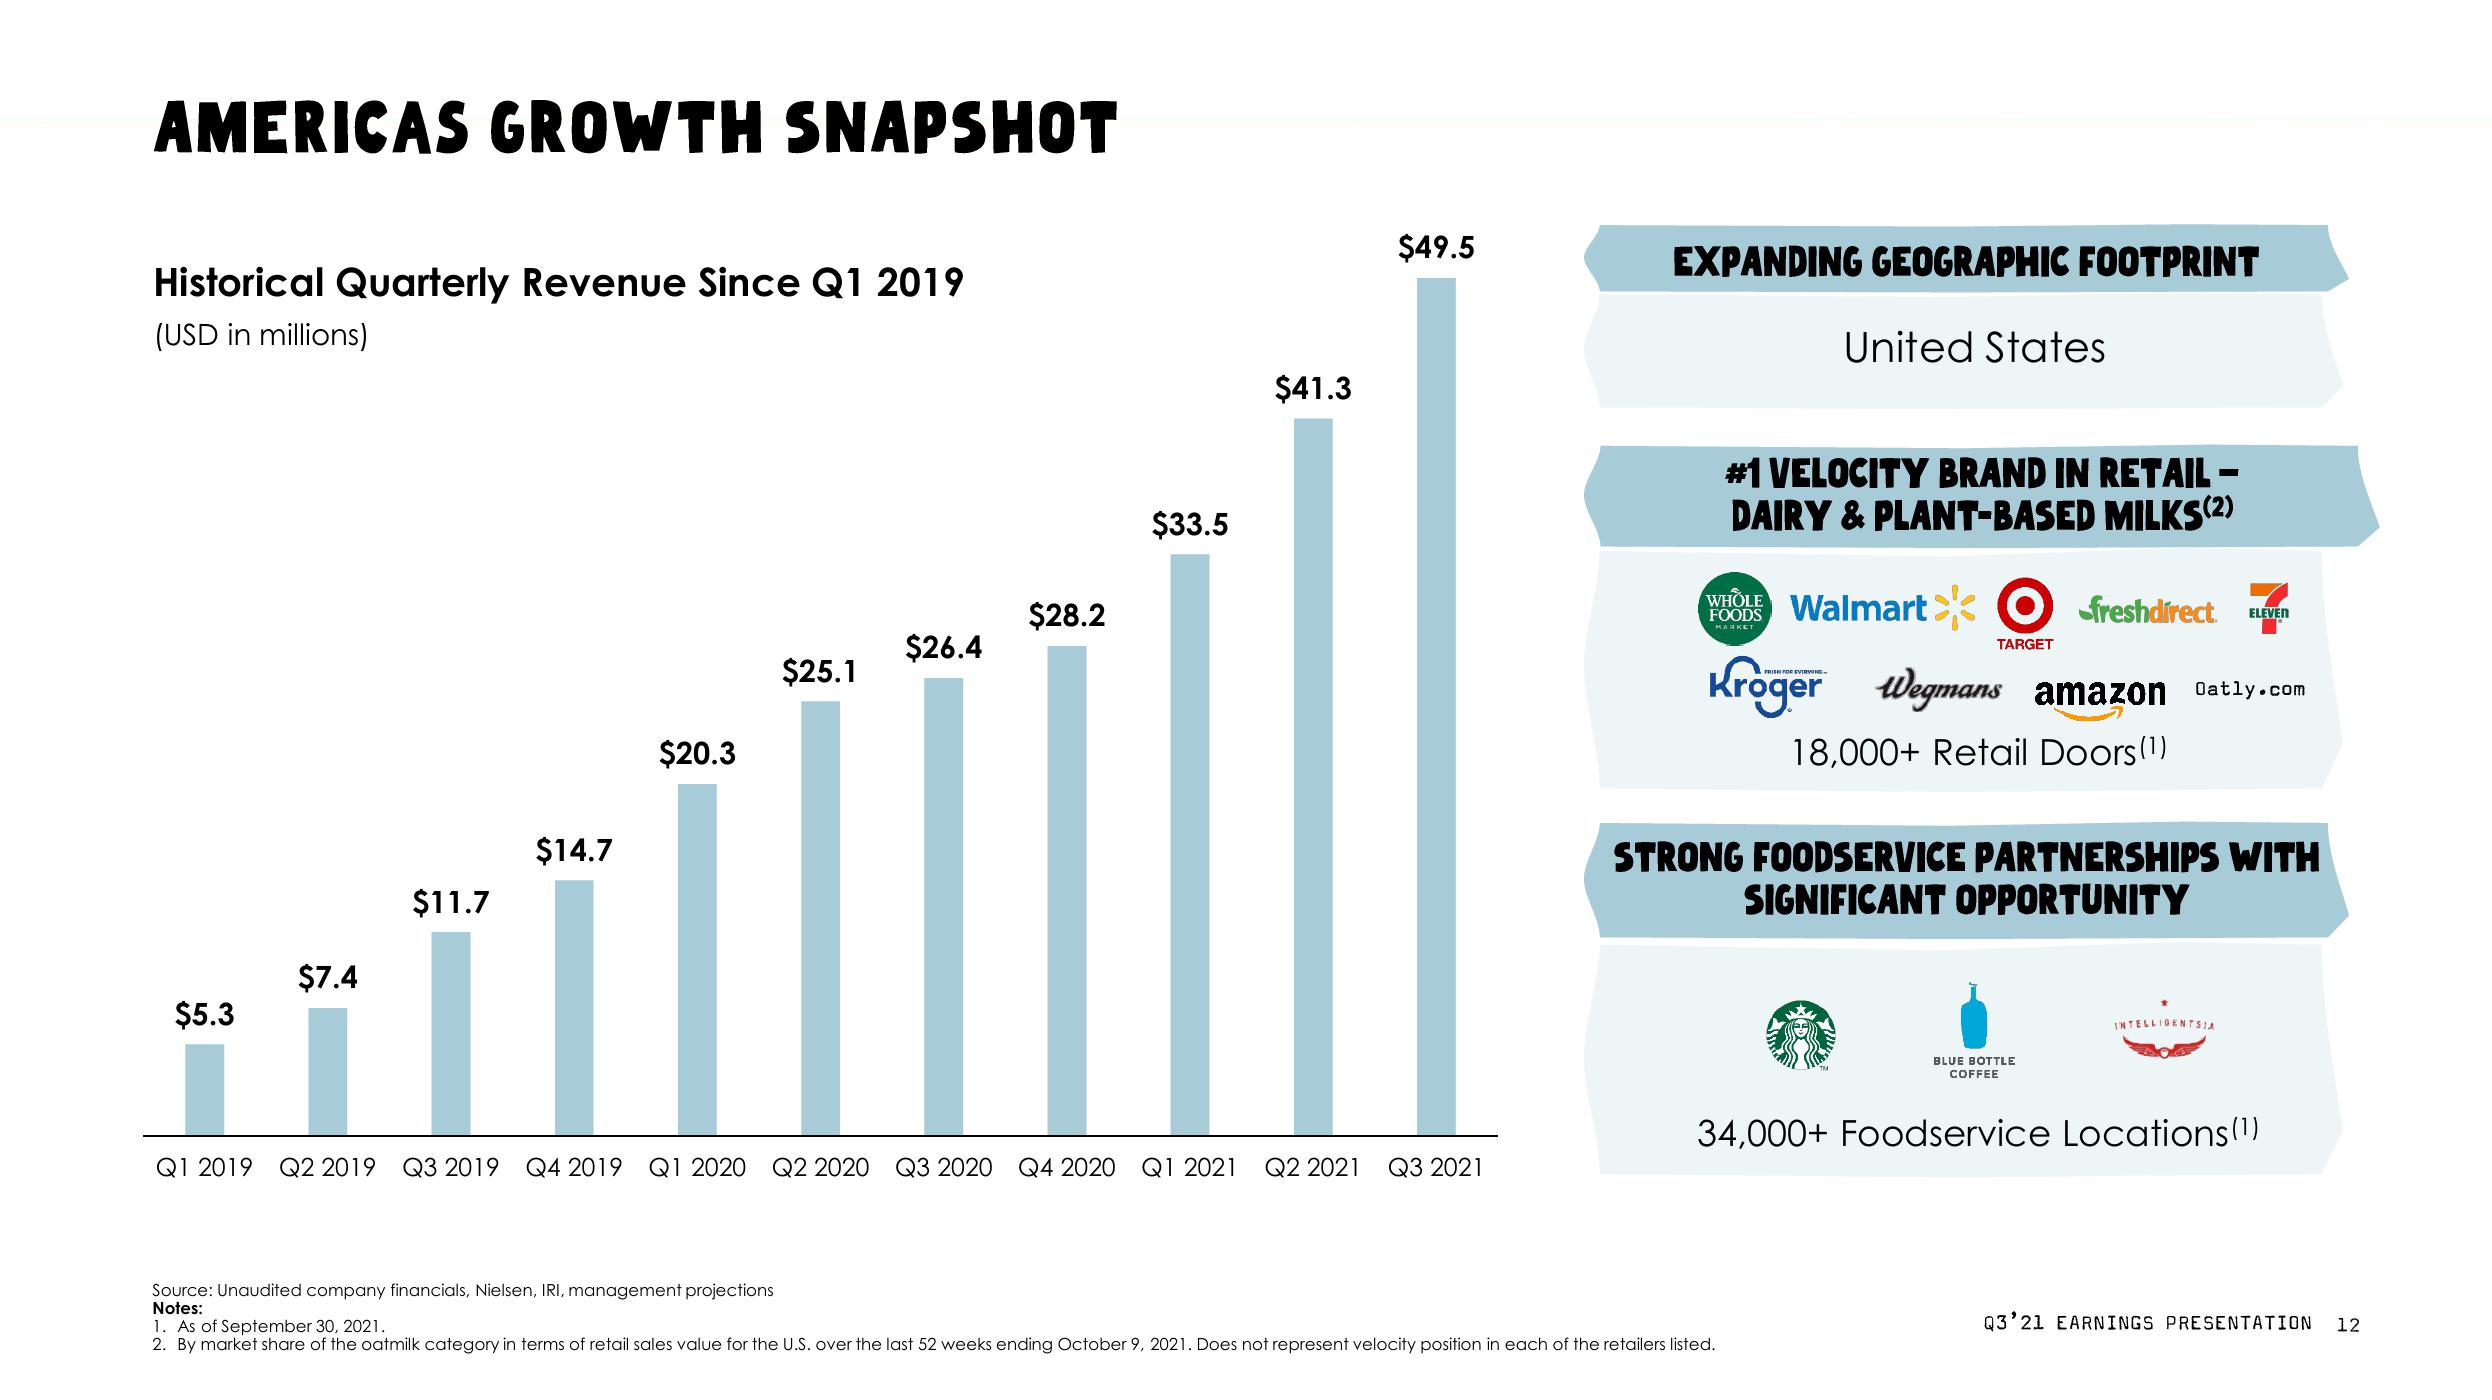
AMERICAS GROWTH SNAPSHOT
Historical Quarterly Revenue Since Q1 2019
(USD in millions)
$14.7
$5.3
$20.3
$25.1
Source: Unaudited company financials, Nielsen, IRI, management projections
Notes:
$26.4
$28.2
$33.5
$41.3
$11.7
$7.4
ÏÏ
Q1 2019 Q2 2019 Q3 2019 Q4 2019 Q1 2020 Q2 2020 Q3 2020 Q4 2020 Q1 2021 Q2 2021 Q3 2021
$49.5
EXPANDING GEOGRAPHIC FOOTPRINT
United States
#1 VELOCITY BRAND IN RETAIL -
DAIRY & PLANT-BASED MILKS(2)
WHOLE Walmart
FOODS
MARKET
TARGET
1. As of September 30, 2021.
2. By market share of the oatmilk category in terms of retail sales value for the U.S. over the last 52 weeks ending October 9, 2021. Does not represent velocity position in each of the retailers listed.
freshdirect
Kroger Wegmans amazon Oatly.com
18,000+ Retail Doors (¹)
STRONG FOODSERVICE PARTNERSHIPS WITH
SIGNIFICANT OPPORTUNITY
BLUE BOTTLE
COFFEE
ELEVEN
INTELLIGENTSIA
34,000+ Foodservice Locations (1)
Q3'21 EARNINGS PRESENTATION
12View entire presentation