Alternus Energy SPAC Presentation Deck
ALTERNUS SNAPSHOT
Germany
Italy
Netherlands
Romania
Poland
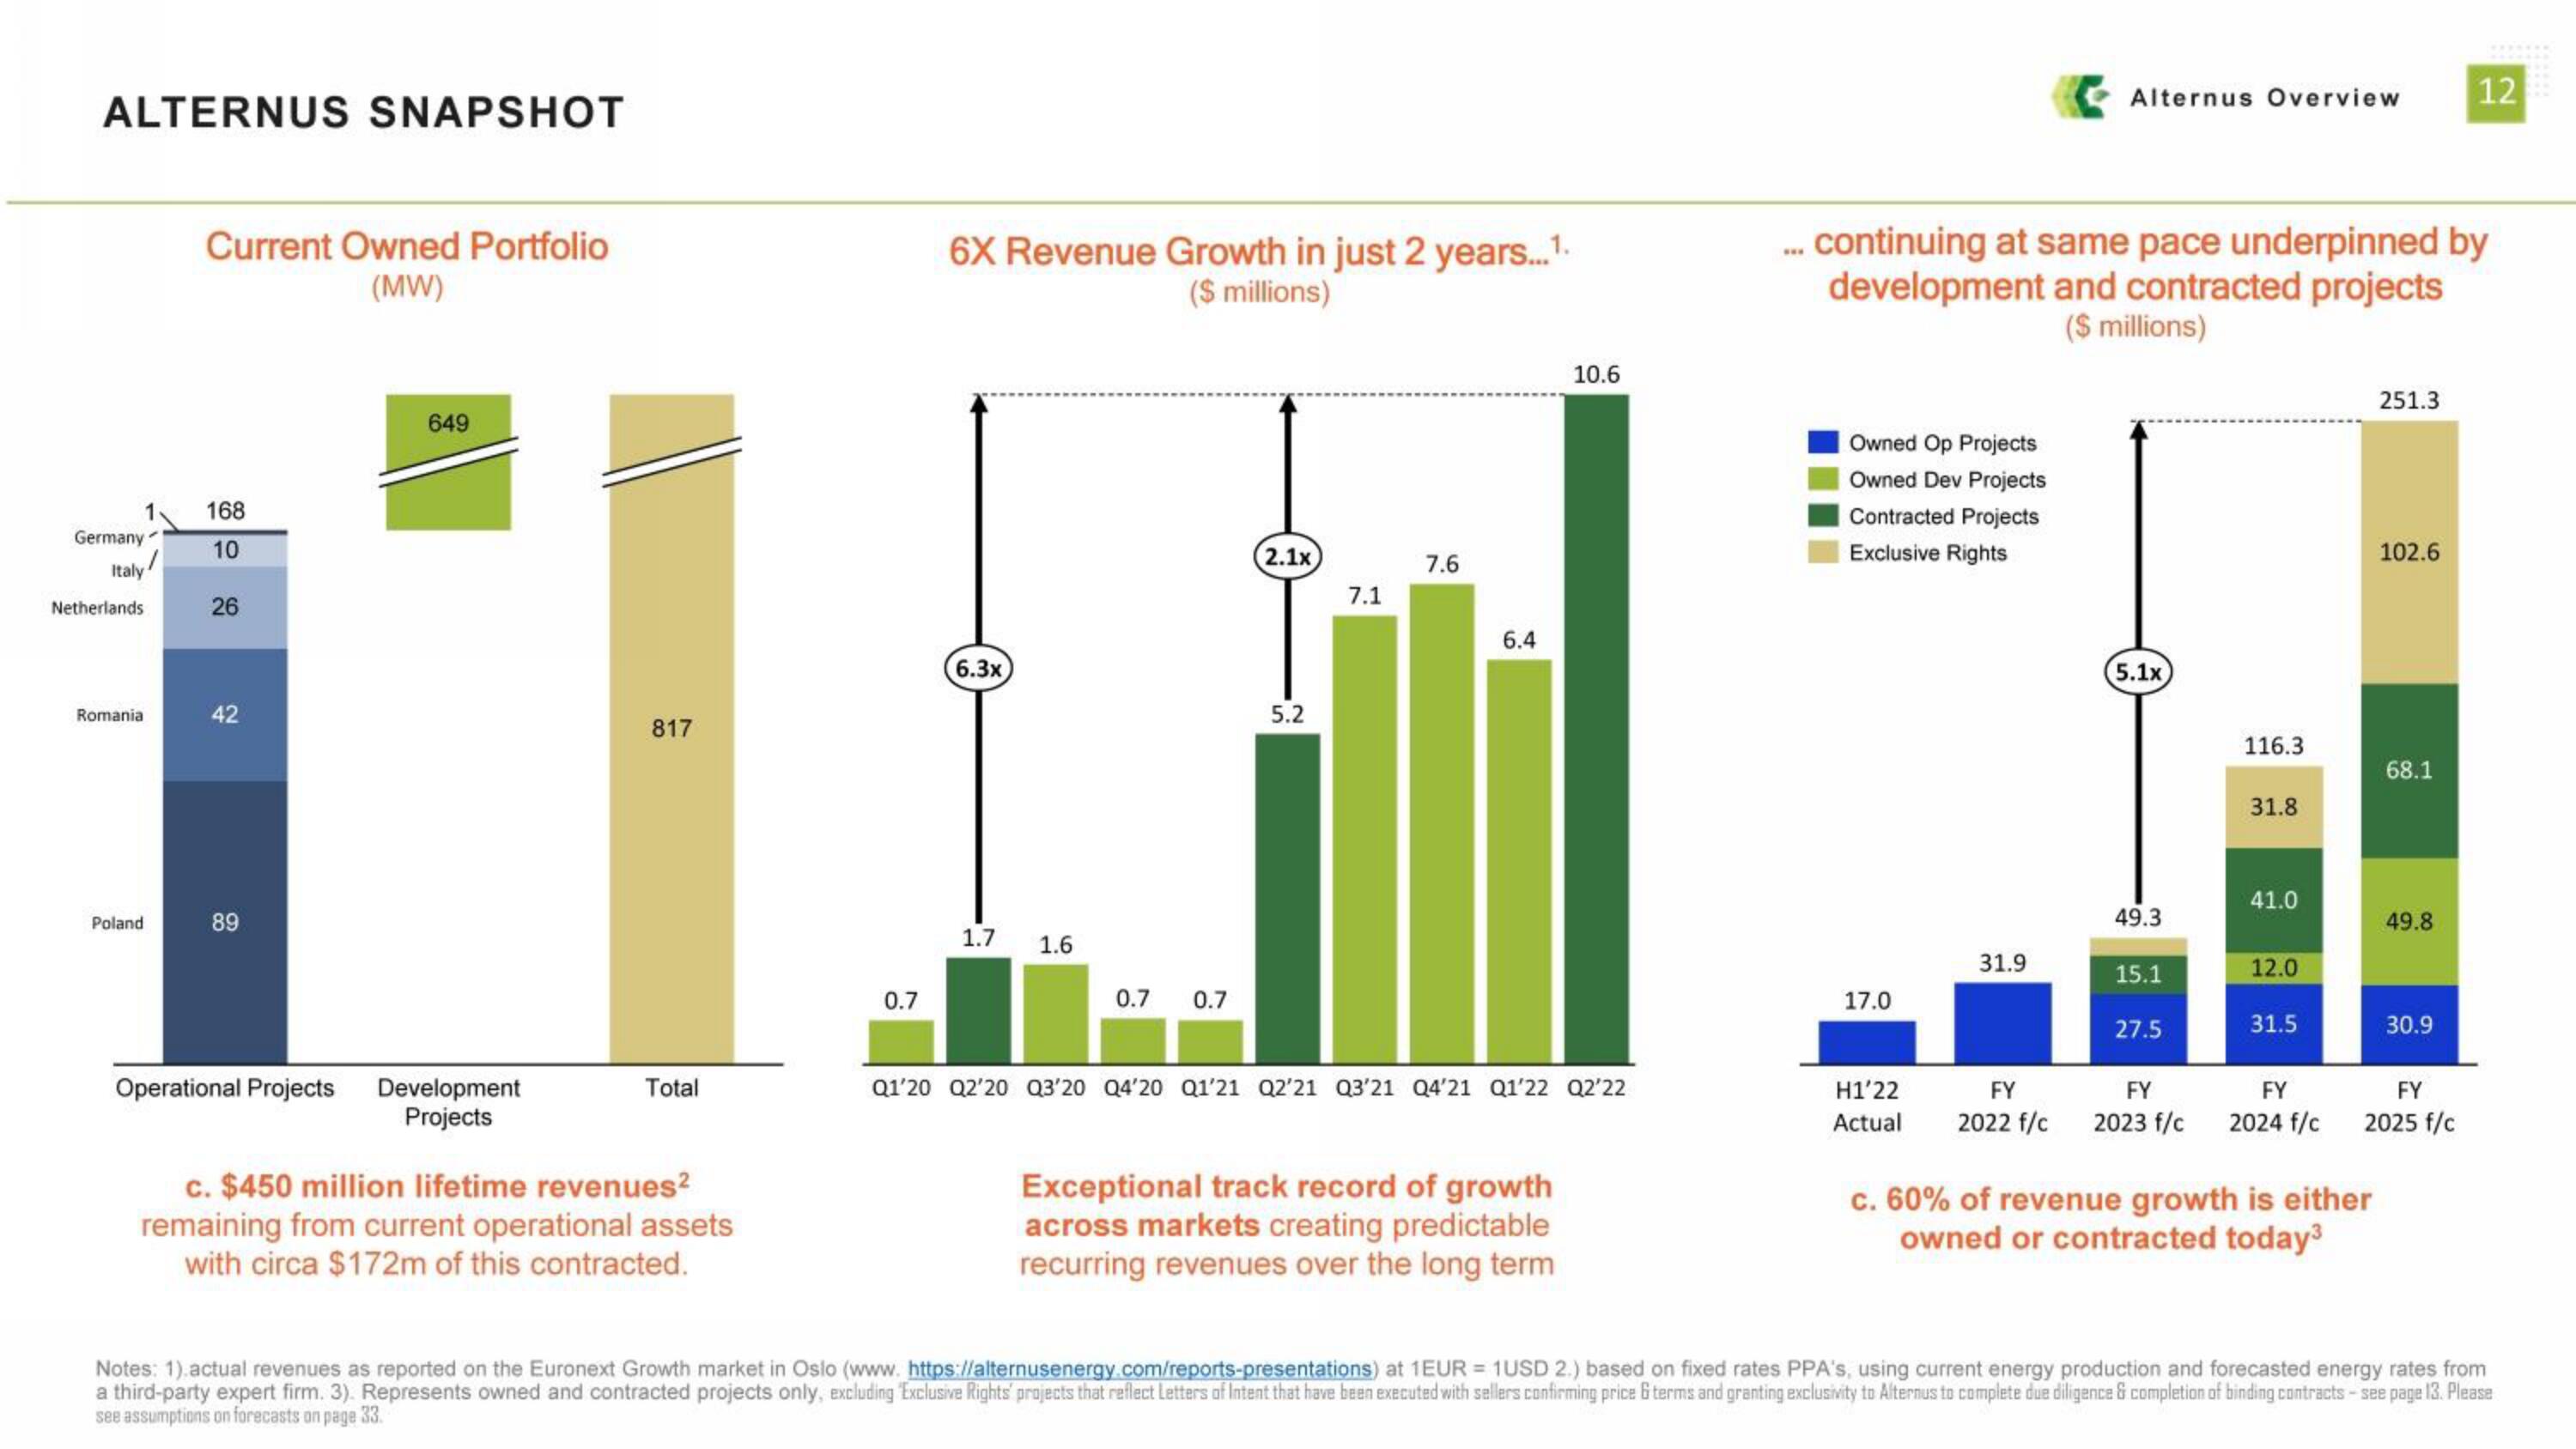
Current Owned Portfolio
(MW)
168
10
26
42
89
Operational Projects
649
Development
Projects
817
Total
c. $450 million lifetime revenues²
remaining from current operational assets
with circa $172m of this contracted.
0.7
6X Revenue Growth in just 2 years...1.
($ millions)
6.3x
1.7 1.6
0.7 0.7
2.1x
5.2
7.1
7.6
6.4
10.6
Q1'20 Q2'20 Q3'20 Q4'20 Q1'21 Q2'21 Q3'21 Q4'21 Q1'22 Q2'22
Exceptional track record of growth
across markets creating predictable
recurring revenues over the long term
Owned Op Projects
Owned Dev Projects
Contracted Projects
Exclusive Rights
continuing at same pace underpinned by
development and contracted projects
($ millions)
17.0
H1’22
Actual
31.9
Alternus Overview
FY
2022 f/c
(5.1x)
49.3
15.1
27.5
116.3
31.8
41.0
12.0
31.5
FY
FY
2023 f/c 2024 f/c
251.3
c. 60% of revenue growth is either
owned or contracted today³
102.6
68.1
49.8
30.9
FY
2025 f/c
12
Notes: 1).actual revenues as reported on the Euronext Growth market in Oslo (www. https://alternusenergy.com/reports-presentations) at 1EUR = 1USD 2.) based on fixed rates PPA's, using current energy production and forecasted energy rates from
a third-party expert firm. 3). Represents owned and contracted projects only, excluding Exclusive Rights' projects that reflect Letters of Intent that have been executed with sellers confirming price 6 terms and granting exclusivity to Alternus to complete due diligence & completion of binding contracts-see page 13. Please
see assumptions on forecasts on page 33.View entire presentation