UBS ESG Presentation Deck
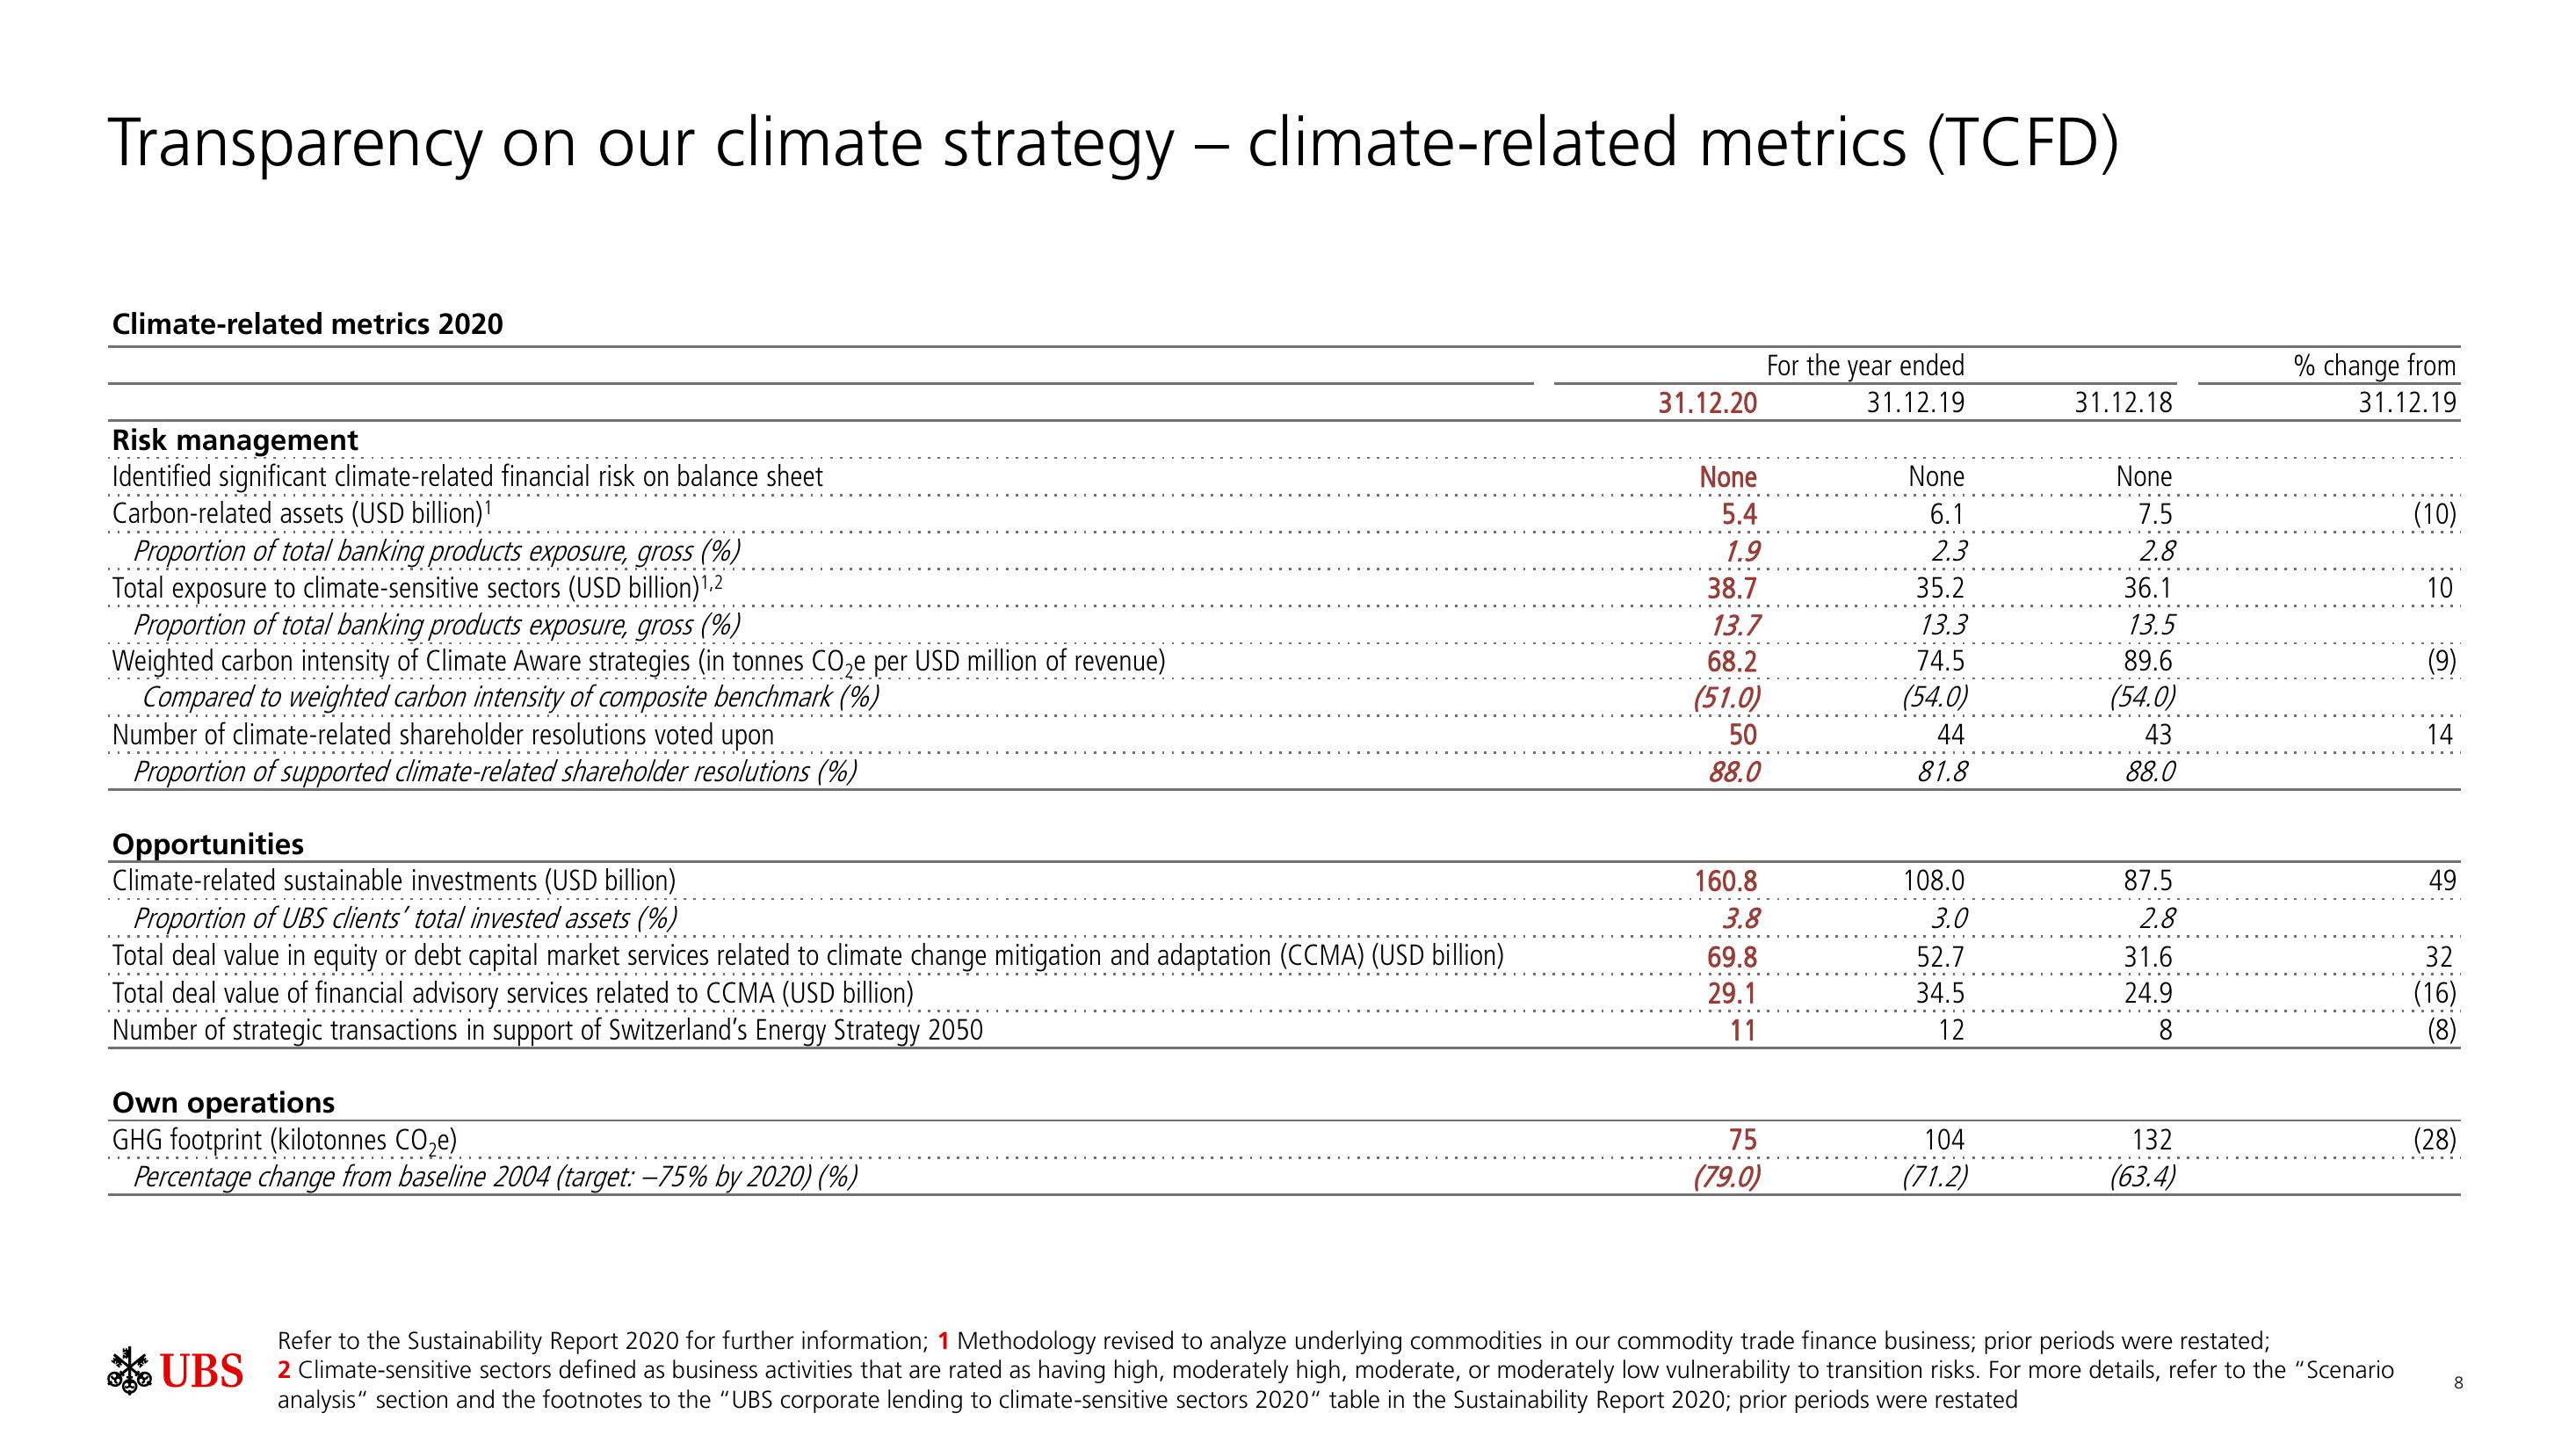
Transparency on our climate strategy - climate-related metrics (TCFD)
Climate-related metrics 2020
Risk management
Identified significant climate-related financial risk on balance sheet
Carbon-related assets (USD billion)1
Proportion of total banking products exposure, gross (%)
Total exposure to climate-sensitive sectors (USD billion)¹,2
Proportion of total banking products exposure, gross (%)
Weighted carbon intensity of Climate Aware strategies (in tonnes CO₂e per USD million of revenue)
Compared to weighted carbon intensity of composite benchmark (%)
Number of climate-related shareholder resolutions voted upon
Proportion of supported climate-related shareholder resolutions (%)
Opportunities
Climate-related sustainable investments (USD billion)
Proportion of UBS clients' total invested assets (%)
Total deal value in equity or debt capital market services related to climate change mitigation and adaptation (CCMA) (USD billion)
Total deal value of financial advisory services related to CCMA (USD billion)
Number of strategic transactions in support of Switzerland's Energy Strategy 2050
Own operations
GHG footprint (kilotonnes CO₂e)
Percentage change from baseline 2004 (target: -75% by 2020) (%)
31.12.20
None
5.4
1.9
38.7
13.7
68.2
(51.0)
50
88.0
160.8
3.8
69.8
29.1
11
75
(79.0)
For the year ended
31.12.19
None
6.1
2.3
35.2
13.3
74.5
(54.0)
44
81.8
108.0
3.0
52.7
34.5
12
104
(71.2)
31.12.18
None
7.5
2.8
36.1
13.5
89.6
(54.0)
43
88.0
87.5
2.8
31.6
24.9
8
132
(63.4)
% change from
31.12.19
Refer to the Sustainability Report 2020 for further information; 1 Methodology revised to analyze underlying commodities in our commodity trade finance business; prior periods were restated;
UBS 2 Climate-sensitive sectors defined as business activities that are rated as having high, moderately high, moderate, or moderately low vulnerability to transition risks. For more details, refer to the "Scenario
analysis" section and the footnotes to the "UBS corporate lending to climate-sensitive sectors 2020" table in the Sustainability Report 2020; prior periods were restated
(10)
10
(9)
14
49
32
(16)
(8)
(28)
8View entire presentation