Dutch Bros Results Presentation Deck
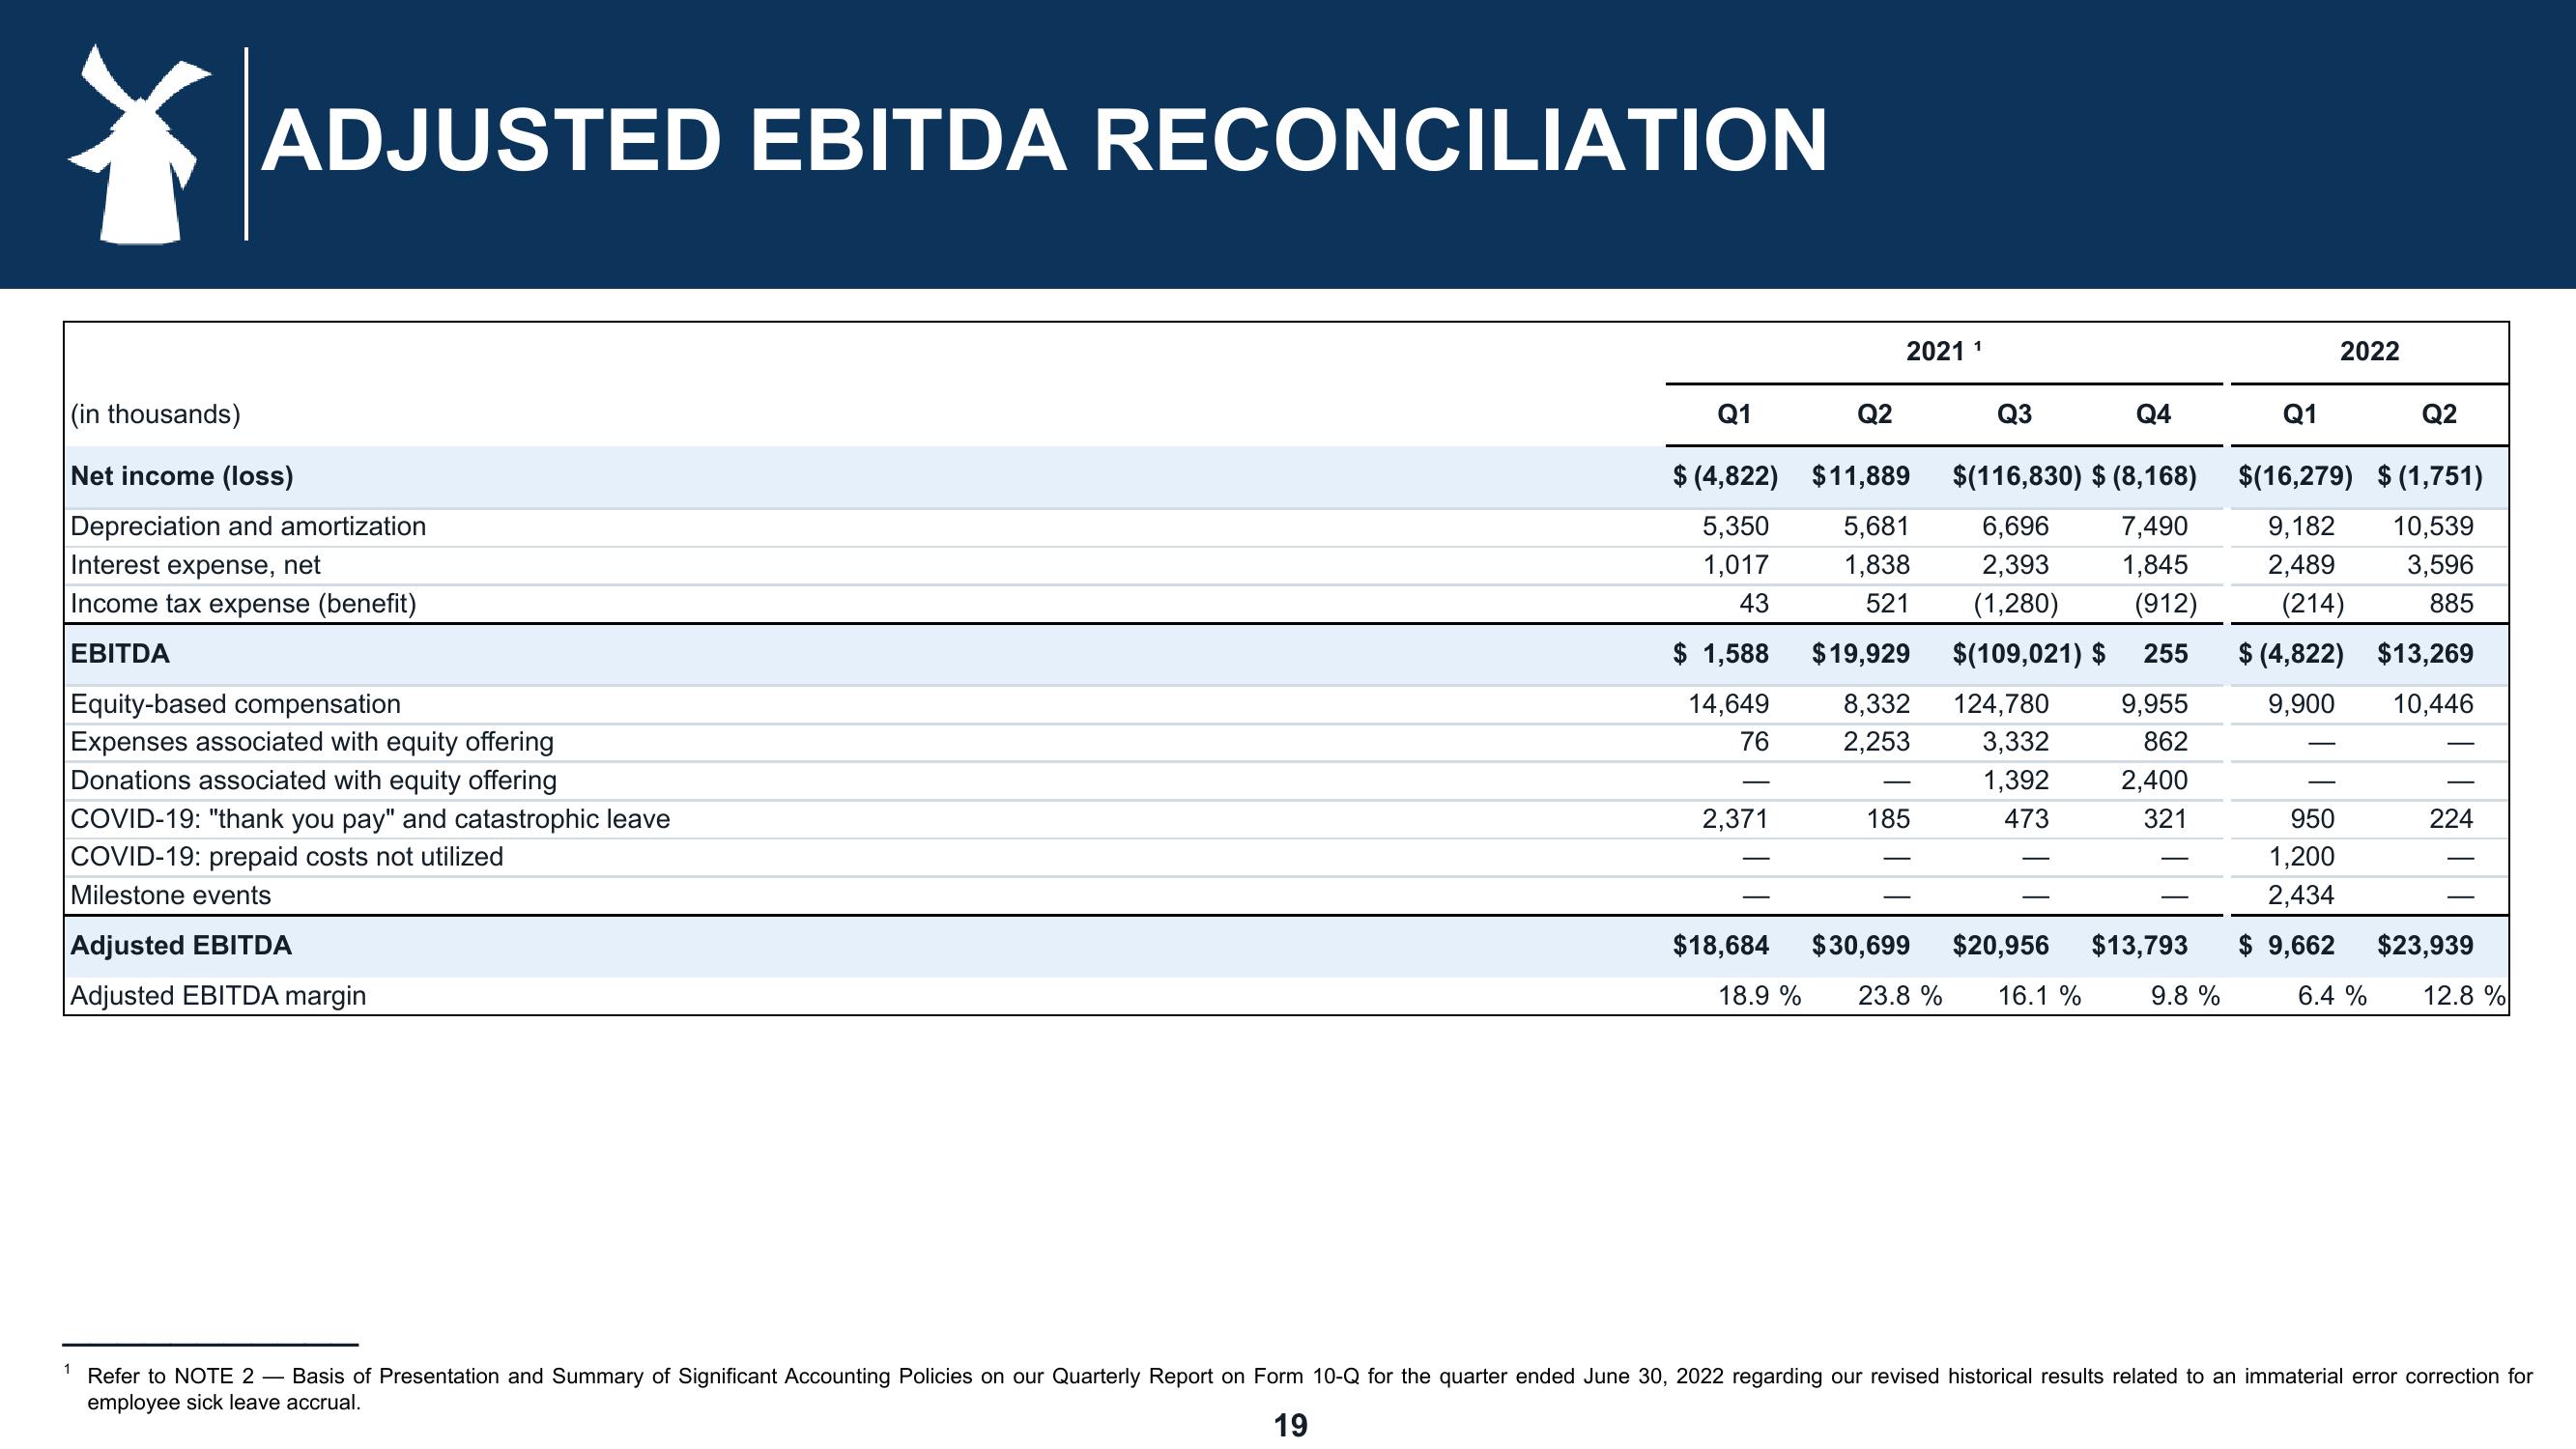
ADJUSTED EBITDA RECONCILIATION
(in thousands)
Net income (loss)
Depreciation and amortization
Interest expense, net
Income tax expense (benefit)
EBITDA
Equity-based compensation
Expenses associated with equity offering
Donations associated with equity offering
COVID-19: "thank you pay" and catastrophic leave
COVID-19: prepaid costs not utilized
Milestone events
Adjusted EBITDA
Adjusted EBITDA margin
Q1
$ (4,822)
5,350
1,017
43
$ 1,588
14,649
76
2,371
2021 1
Q2
$11,889
5,681
1,838
521
$19,929
8,332
2,253
185
Q3
$(116,830) $ (8,168)
6,696 7,490
2,393 1,845
(1,280) (912)
$(109,021) $ 255
124,780 9,955
3,332
862
1,392
473
2,400
321
Q4
$18,684 $30,699 $20,956 $13,793
18.9 % 23.8 % 16.1 %
9.8 %
2022
Q1
Q2
$(16,279) $(1,751)
2,489
9,182 10,539
3,596
(214) 885
$(4,822) $13,269
9,900
10,446
950
1,200
2,434
$ 9,662
6.4 %
224
$23,939
12.8 %
1 Refer to NOTE 2 - Basis of Presentation and Summary of Significant Accounting Policies on our Quarterly Report on Form 10-Q for the quarter ended June 30, 2022 regarding our revised historical results related to an immaterial error correction for
employee sick leave accrual.
19View entire presentation