Dave Results Presentation Deck
Improving delinquency
performance
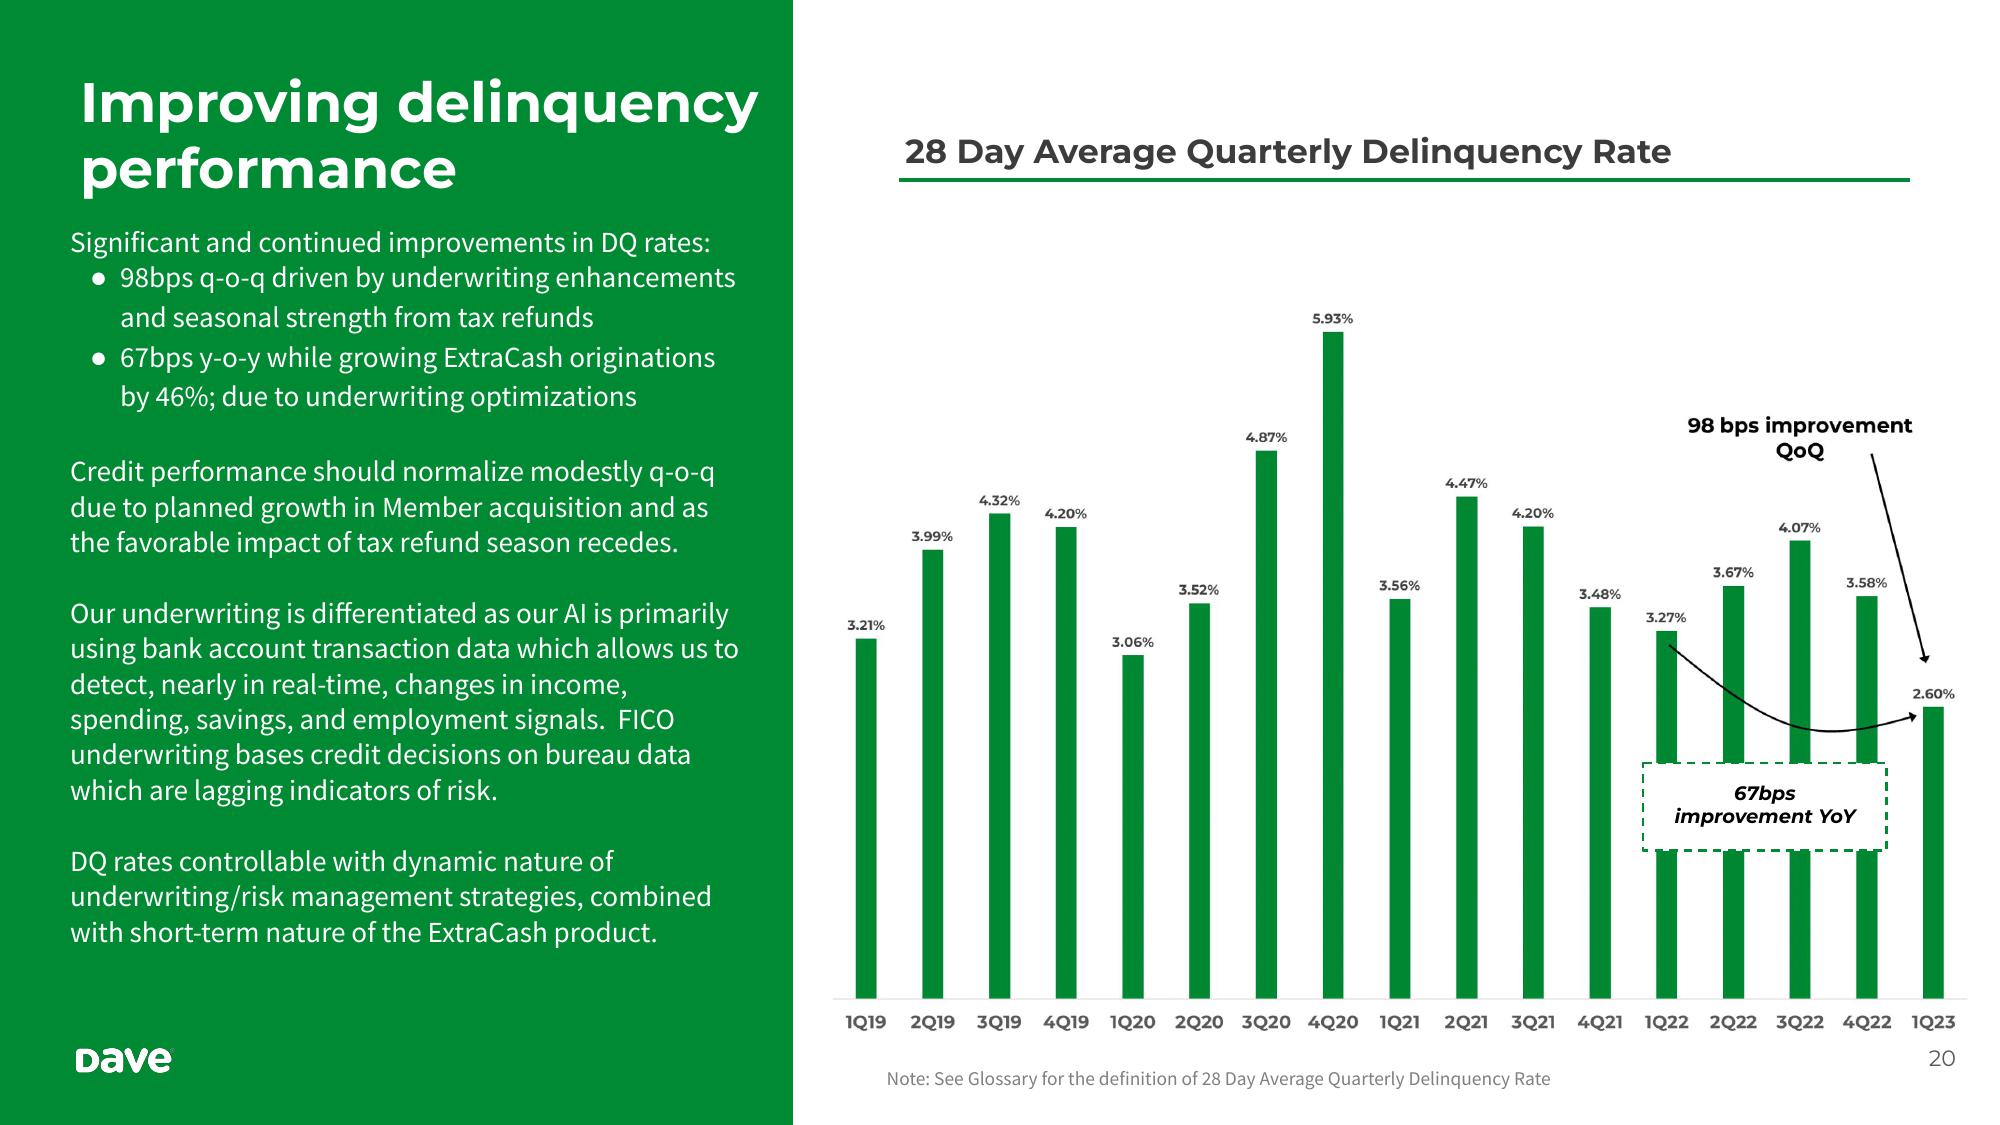
Significant and continued improvements in DQ rates:
98bps q-o-q driven by underwriting enhancements
and seasonal strength from tax refunds
• 67bps y-o-y while growing ExtraCash originations
by 46%; due to underwriting optimizations
Credit performance should normalize modestly q-o-q
due to planned growth in Member acquisition and as
the favorable impact of tax refund season recedes.
Our underwriting is differentiated as our Al is primarily
using bank account transaction data which allows us to
detect, nearly in real-time, changes in income,
spending, savings, and employment signals. FICO
underwriting bases credit decisions on bureau data
which are lagging indicators of risk.
DQ rates controllable with dynamic nature of
underwriting/risk management strategies, combined
with short-term nature of the ExtraCash product.
Dave
3.21%
1Q19
28 Day Average Quarterly Delinquency Rate
3.99%
4.32%
4.20%
3.06%
3.52%
4.87%
5.93%
3.56%
4.47%
4.20%
3.48%
Note: See Glossary for the definition of 28 Day Average Quarterly Delinquency Rate
3.27%
98 bps improvement
QoQ
4.07%
3.67%
3.58%
ili
67bps
improvement YoY
2.60%
III
LIITT
2Q19 3Q19 4Q19 1020 2020 3Q20 4020 1021 2Q21 3Q21 4Q21 1Q22 2022 3Q22 4Q22 1023
20View entire presentation