Tesla Results Presentation Deck
7
VEHICLE CAPACITY
During the quarter we brought down several production lines for upgrades at
various factories, which led to a sequential decline in production volumes. We made
further progress smoothing out the delivery rate across the quarter, with September
accounting for ~40% of Q3 deliveries this year, compared to September accounting
for -65% of Q3 deliveries in 2022.
US: California, Nevada and Texas
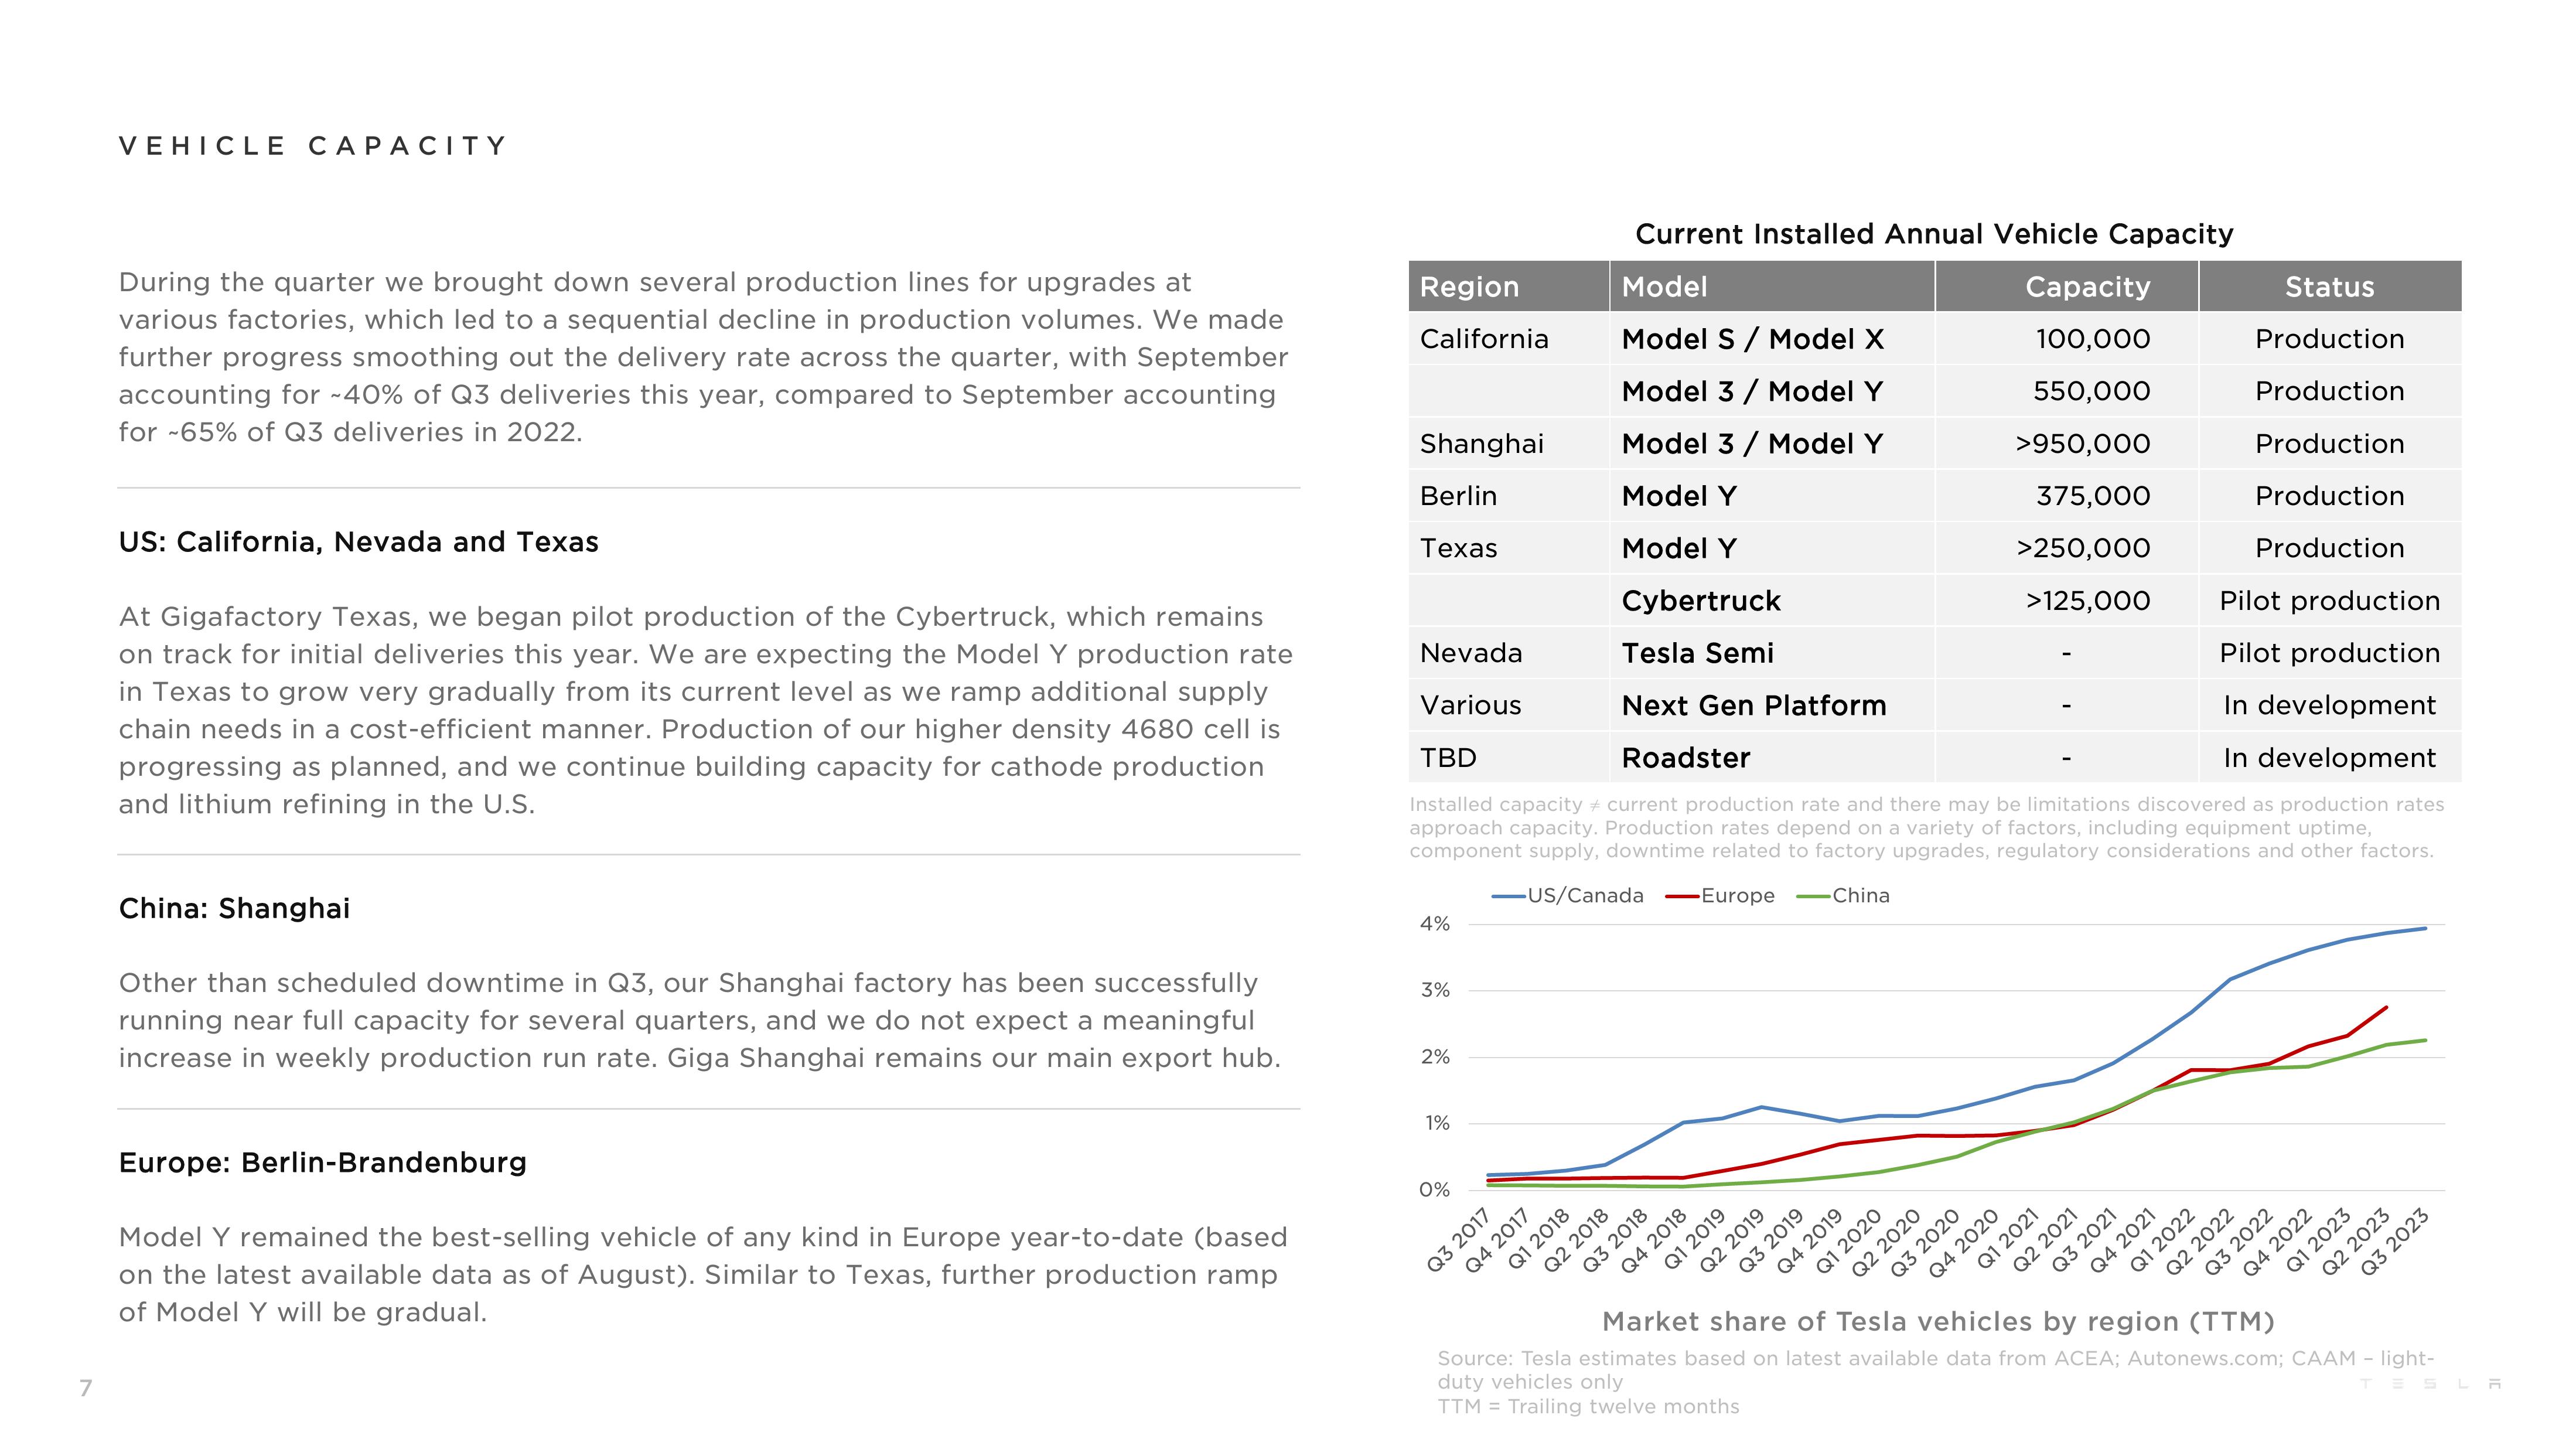
At Gigafactory Texas, we began pilot production of the Cybertruck, which remains
on track for initial deliveries this year. We are expecting the Model Y production rate
in Texas to grow very gradually from its current level as we ramp additional supply
chain needs in a cost-efficient manner. Production of our higher density 4680 cell is
progressing as planned, and we continue building capacity for cathode production
and lithium refining in the U.S.
China: Shanghai
Other than scheduled downtime in Q3, our Shanghai factory has been successfully
running near full capacity for several quarters, and we do not expect a meaningful
increase in weekly production run rate. Giga Shanghai remains our main export hub.
Europe: Berlin-Brandenburg
Model Y remained the best-selling vehicle of any kind in Europe year-to-date (based
on the latest available data as of August). Similar to Texas, further production ramp
of Model Y will be gradual.
Region
California
Shanghai
Berlin
Texas
Nevada
Various
4%
Pilot production
Pilot production
In development
In development
TBD
Installed capacity current production rate and there may be limitations discovered as production rates
approach capacity. Production rates depend on a variety of factors, including equipment uptime,
component supply, downtime related to factory upgrades, regulatory considerations and
other factors.
-US/Canada Europe -China
3%
2%
1%
0%
Q1 2018
Current Installed Annual Vehicle Capacity
Model
Model S / Model X
Model 3 / Model Y
Model 3 / Model Y
Model Y
Model Y
Cybertruck
Tesla Semi
Next Gen Platform
Roadster
Q2 2018
Q3 2018
Q4 2018
Q1 2019
Q2 2019
Q3 2019
Q4 2019
Q1 2020
Q2 2020
Capacity
100,000
550,000
>950,000
375,000
>250,000
>125,000
Q3 2020
Q1 2021
Q4 2020
Q2 2021
Q3 2021
Q4 2021
Q1 2022
Status
Production
Production
Production
Production
Production
Q2 2022
Q3 2022
Q4 2022
Q1 2023
Q2 2023
Q3 2023
vehicles
by region (TTM)
Market share of Tesla
Source: Tesla estimates based on latest available data from ACEA; Autonews.com; CAAM - light-
duty vehicles only
TTM = Trailing twelve monthsView entire presentation