Schroders Results Presentation Deck
Schroders 2021 Full-Year Results
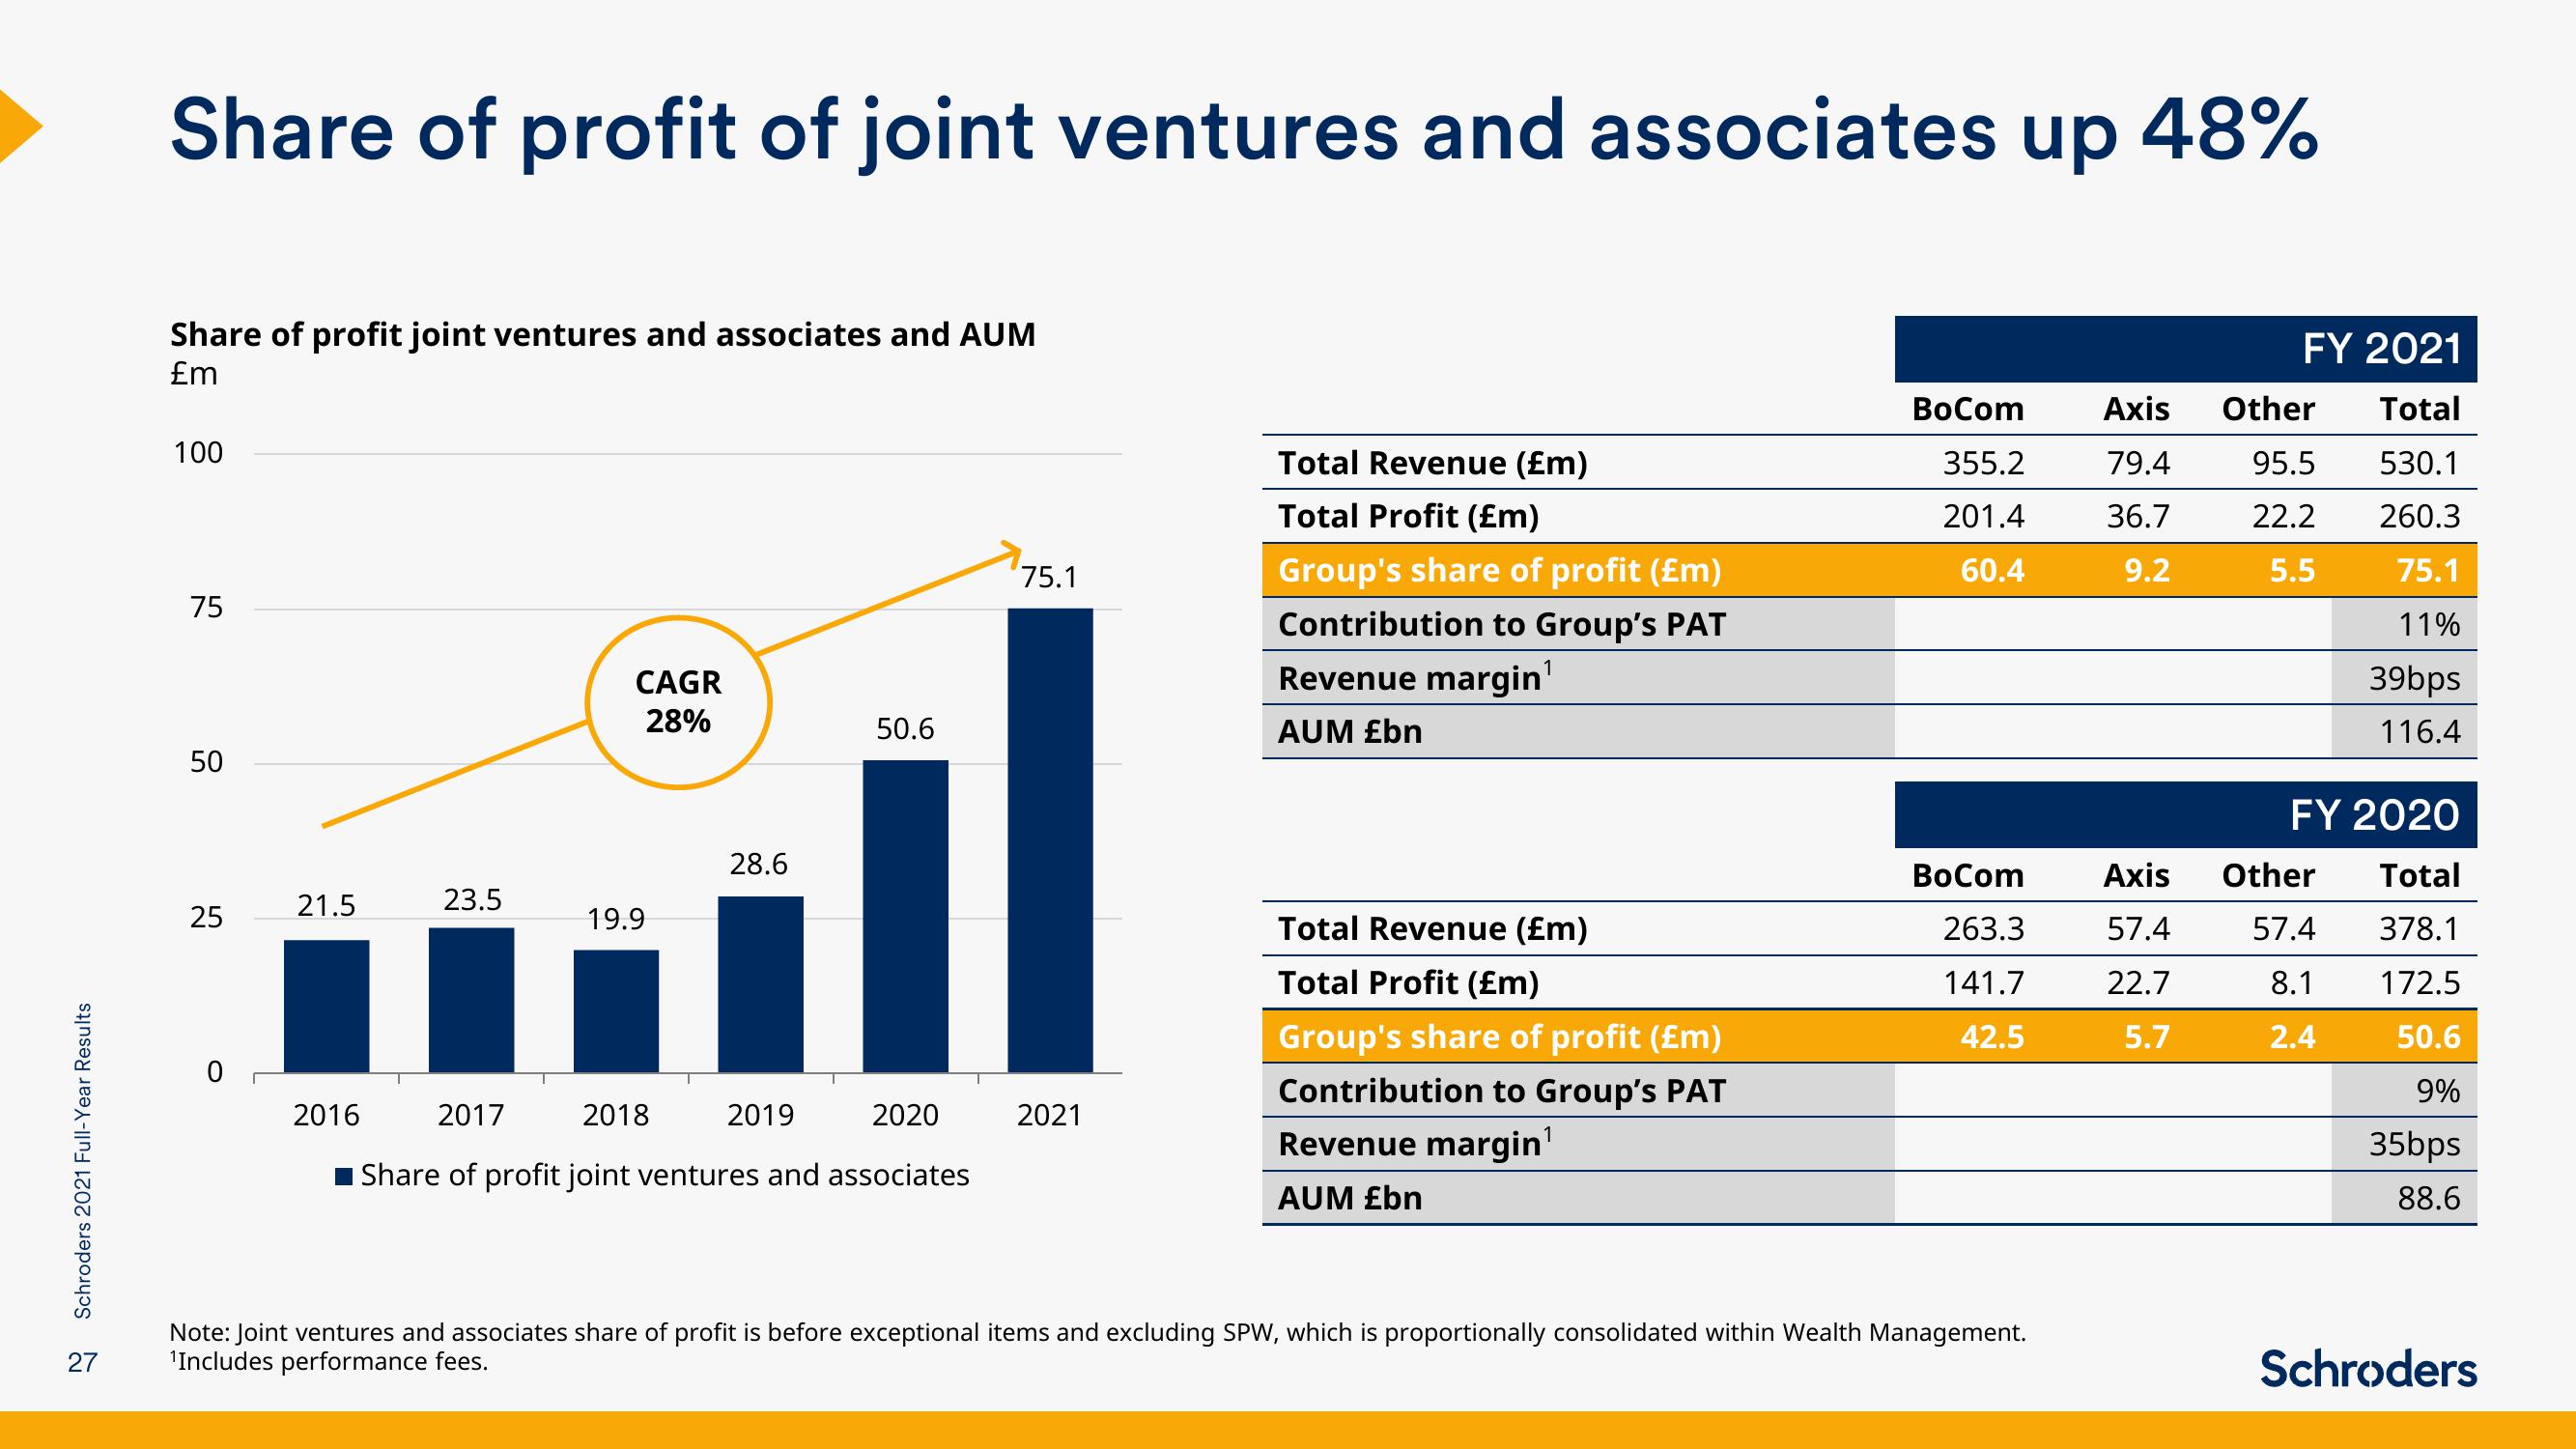
Share of profit of joint ventures and associates up 48%
Share of profit joint ventures and associates and AUM
£m
100
75
50
25
21.5
2016
23.5
CAGR
28%
19.9
28.6
2019
50.6
2017
2018
2020
■Share of profit joint ventures and associates
75.1
2021
Total Revenue (£m)
Total Profit (£m)
Group's share of profit (£m)
Contribution to Group's PAT
Revenue margin¹
AUM £bn
Total Revenue (£m)
Total Profit (£m)
Group's share of profit (£m)
Contribution to Group's PAT
Revenue margin¹
AUM £bn
BoCom
355.2
201.4
60.4
BoCom
263.3
141.7
42.5
Note: Joint ventures and associates share of profit is before exceptional items and excluding SPW, which is proportionally consolidated within Wealth Management.
27 ¹Includes performance fees.
FY 2021
Axis Other Total
95.5
79.4
36.7
22.2
530.1
260.3
75.1
9.2
5.5
11%
39bps
116.4
Axis
57.4
22.7
5.7
FY 2020
Other Total
57.4 378.1
8.1
172.5
50.6
2.4
9%
35bps
88.6
SchrodersView entire presentation