Kinnevik Results Presentation Deck
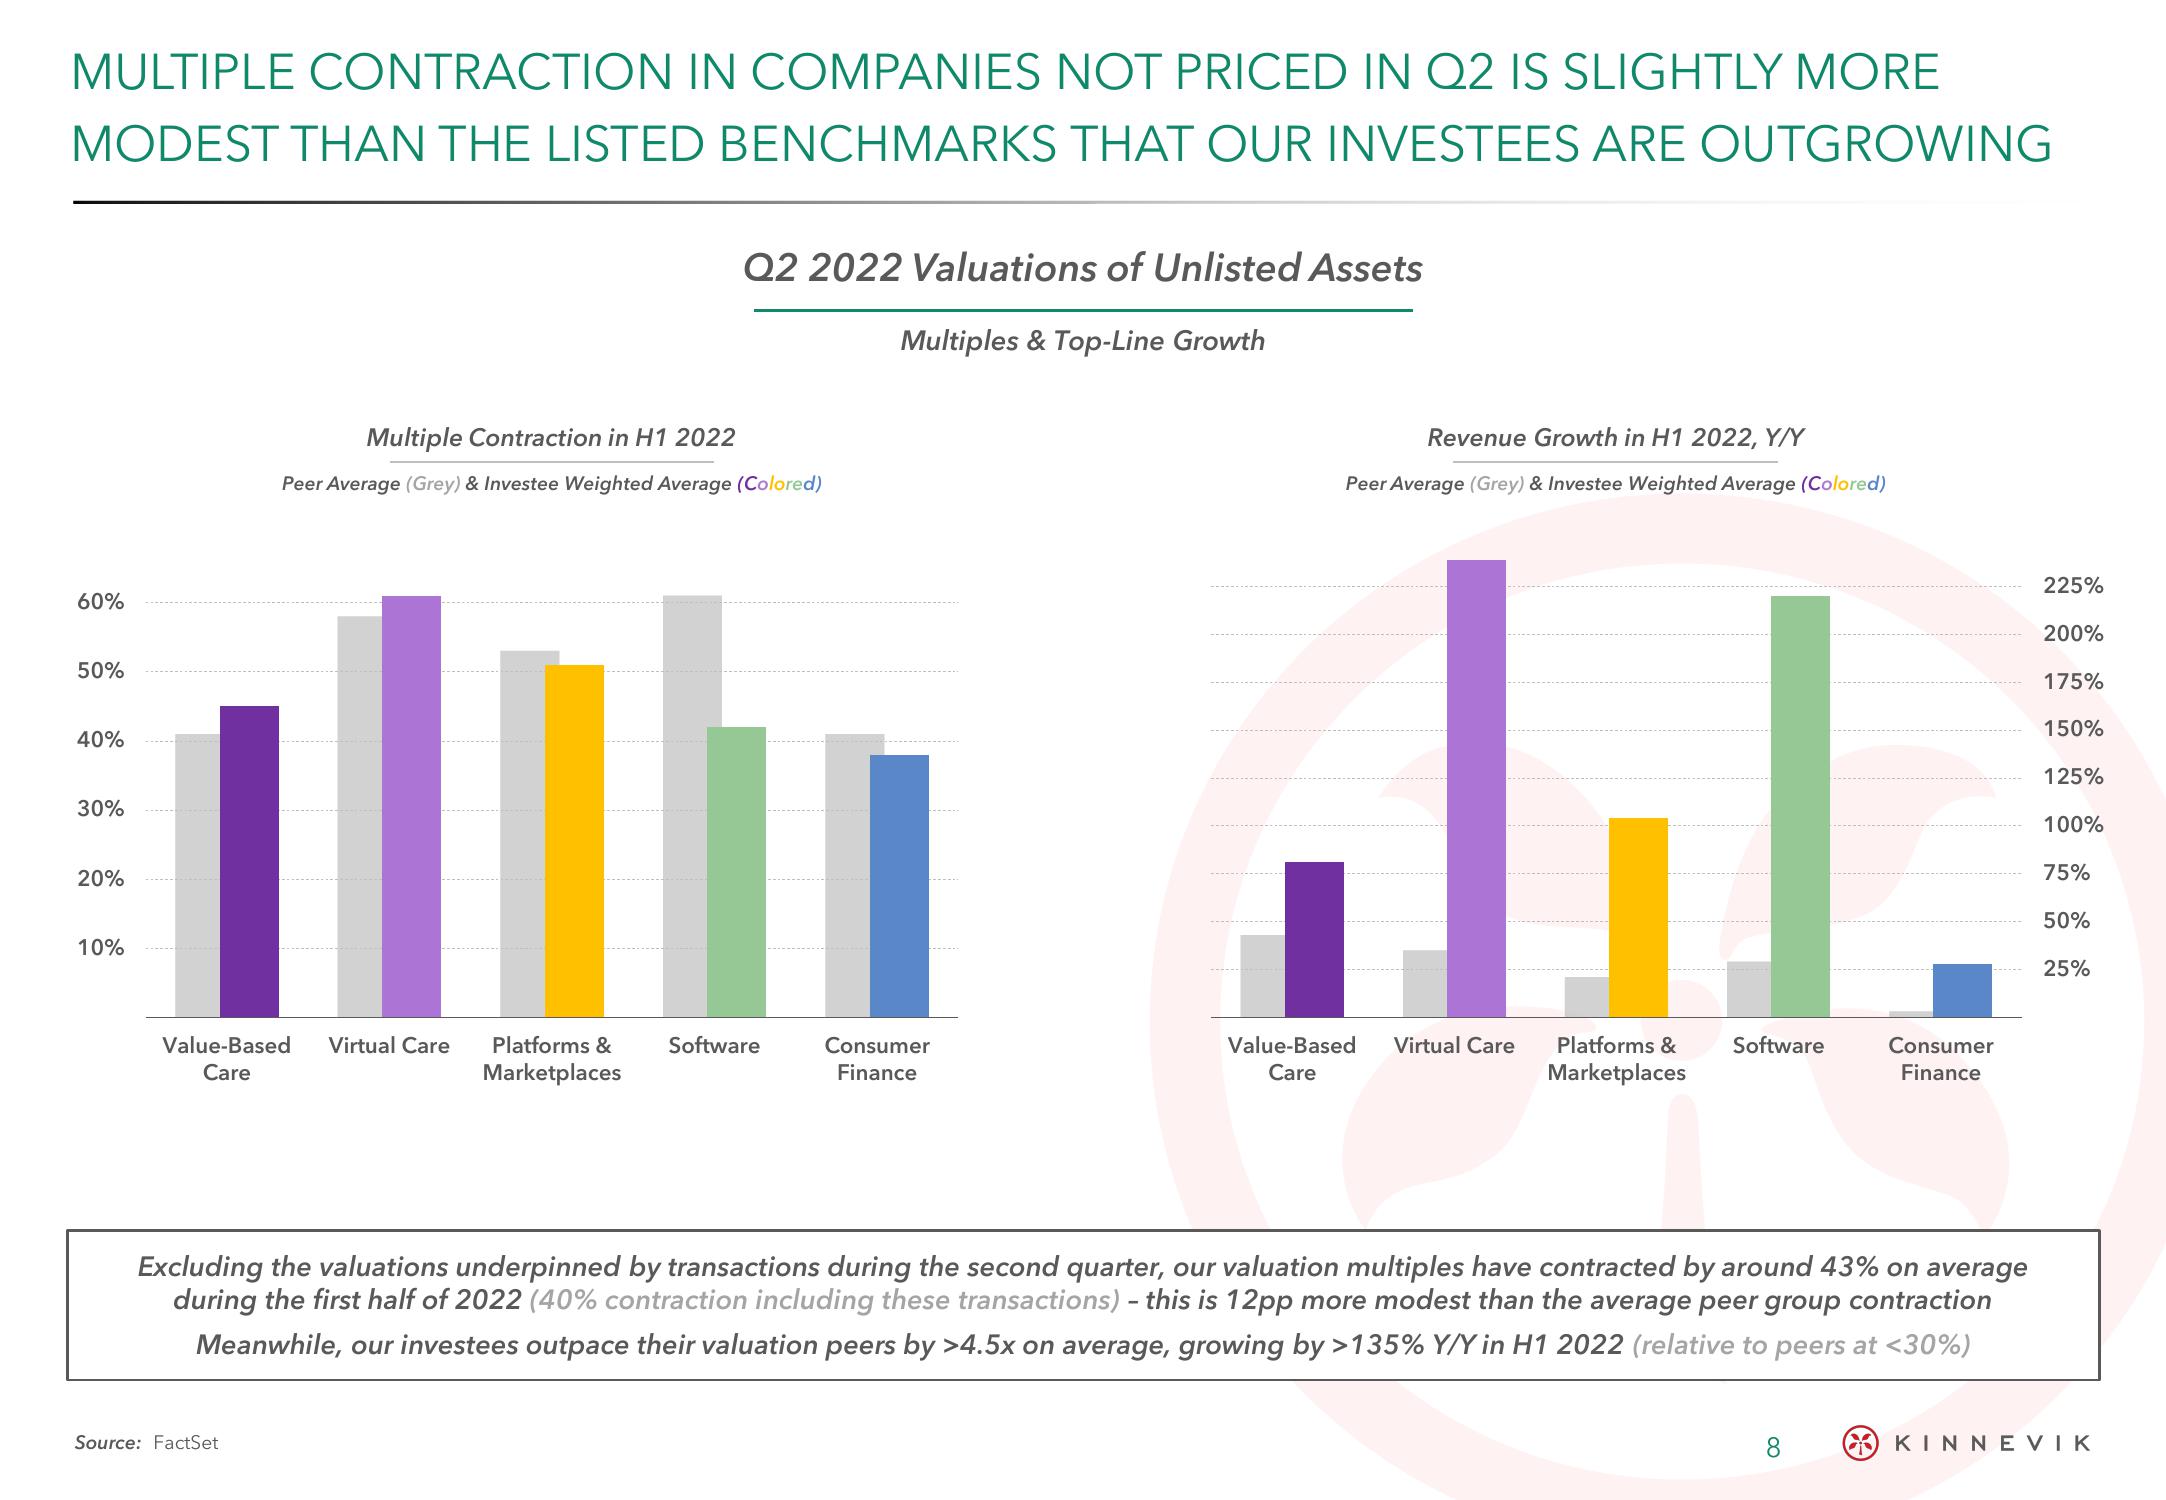
MULTIPLE CONTRACTION IN COMPANIES NOT PRICED IN Q2 IS SLIGHTLY MORE
MODEST THAN THE LISTED BENCHMARKS THAT OUR INVESTEES ARE OUTGROWING
60%
50%
40%
30%
20%
10%
Value-Based Virtual Care
Care
Multiple Contraction in H1 2022
Peer Average (Grey) & Investee Weighted Average (Colored)
Source: FactSet
Q2 2022 Valuations of Unlisted Assets
Multiples & Top-Line Growth
Platforms &
Marketplaces
Software
Consumer
Finance
Revenue Growth in H1 2022, Y/Y
Peer Average (Grey) & Investee Weighted Average (Colored)
Value-Based
Care
Jl.
Platforms &
Marketplaces
Virtual Care
Software
Excluding the valuations underpinned by transactions during the second quarter, our valuation multiples have contracted by around 43% on average
during the first half of 2022 (40% contraction including these transactions) - this is 12pp more modest than the average peer group contraction
Meanwhile, our investees outpace their valuation peers by >4.5x on average, growing by >135% Y/Y in H1 2022 (relative to peers at <30%)
Consumer
Finance
8
225%
200%
175%
150%
125%
100%
75%
50%
25%
KINNEVIKView entire presentation