Intertek Results Presentation Deck
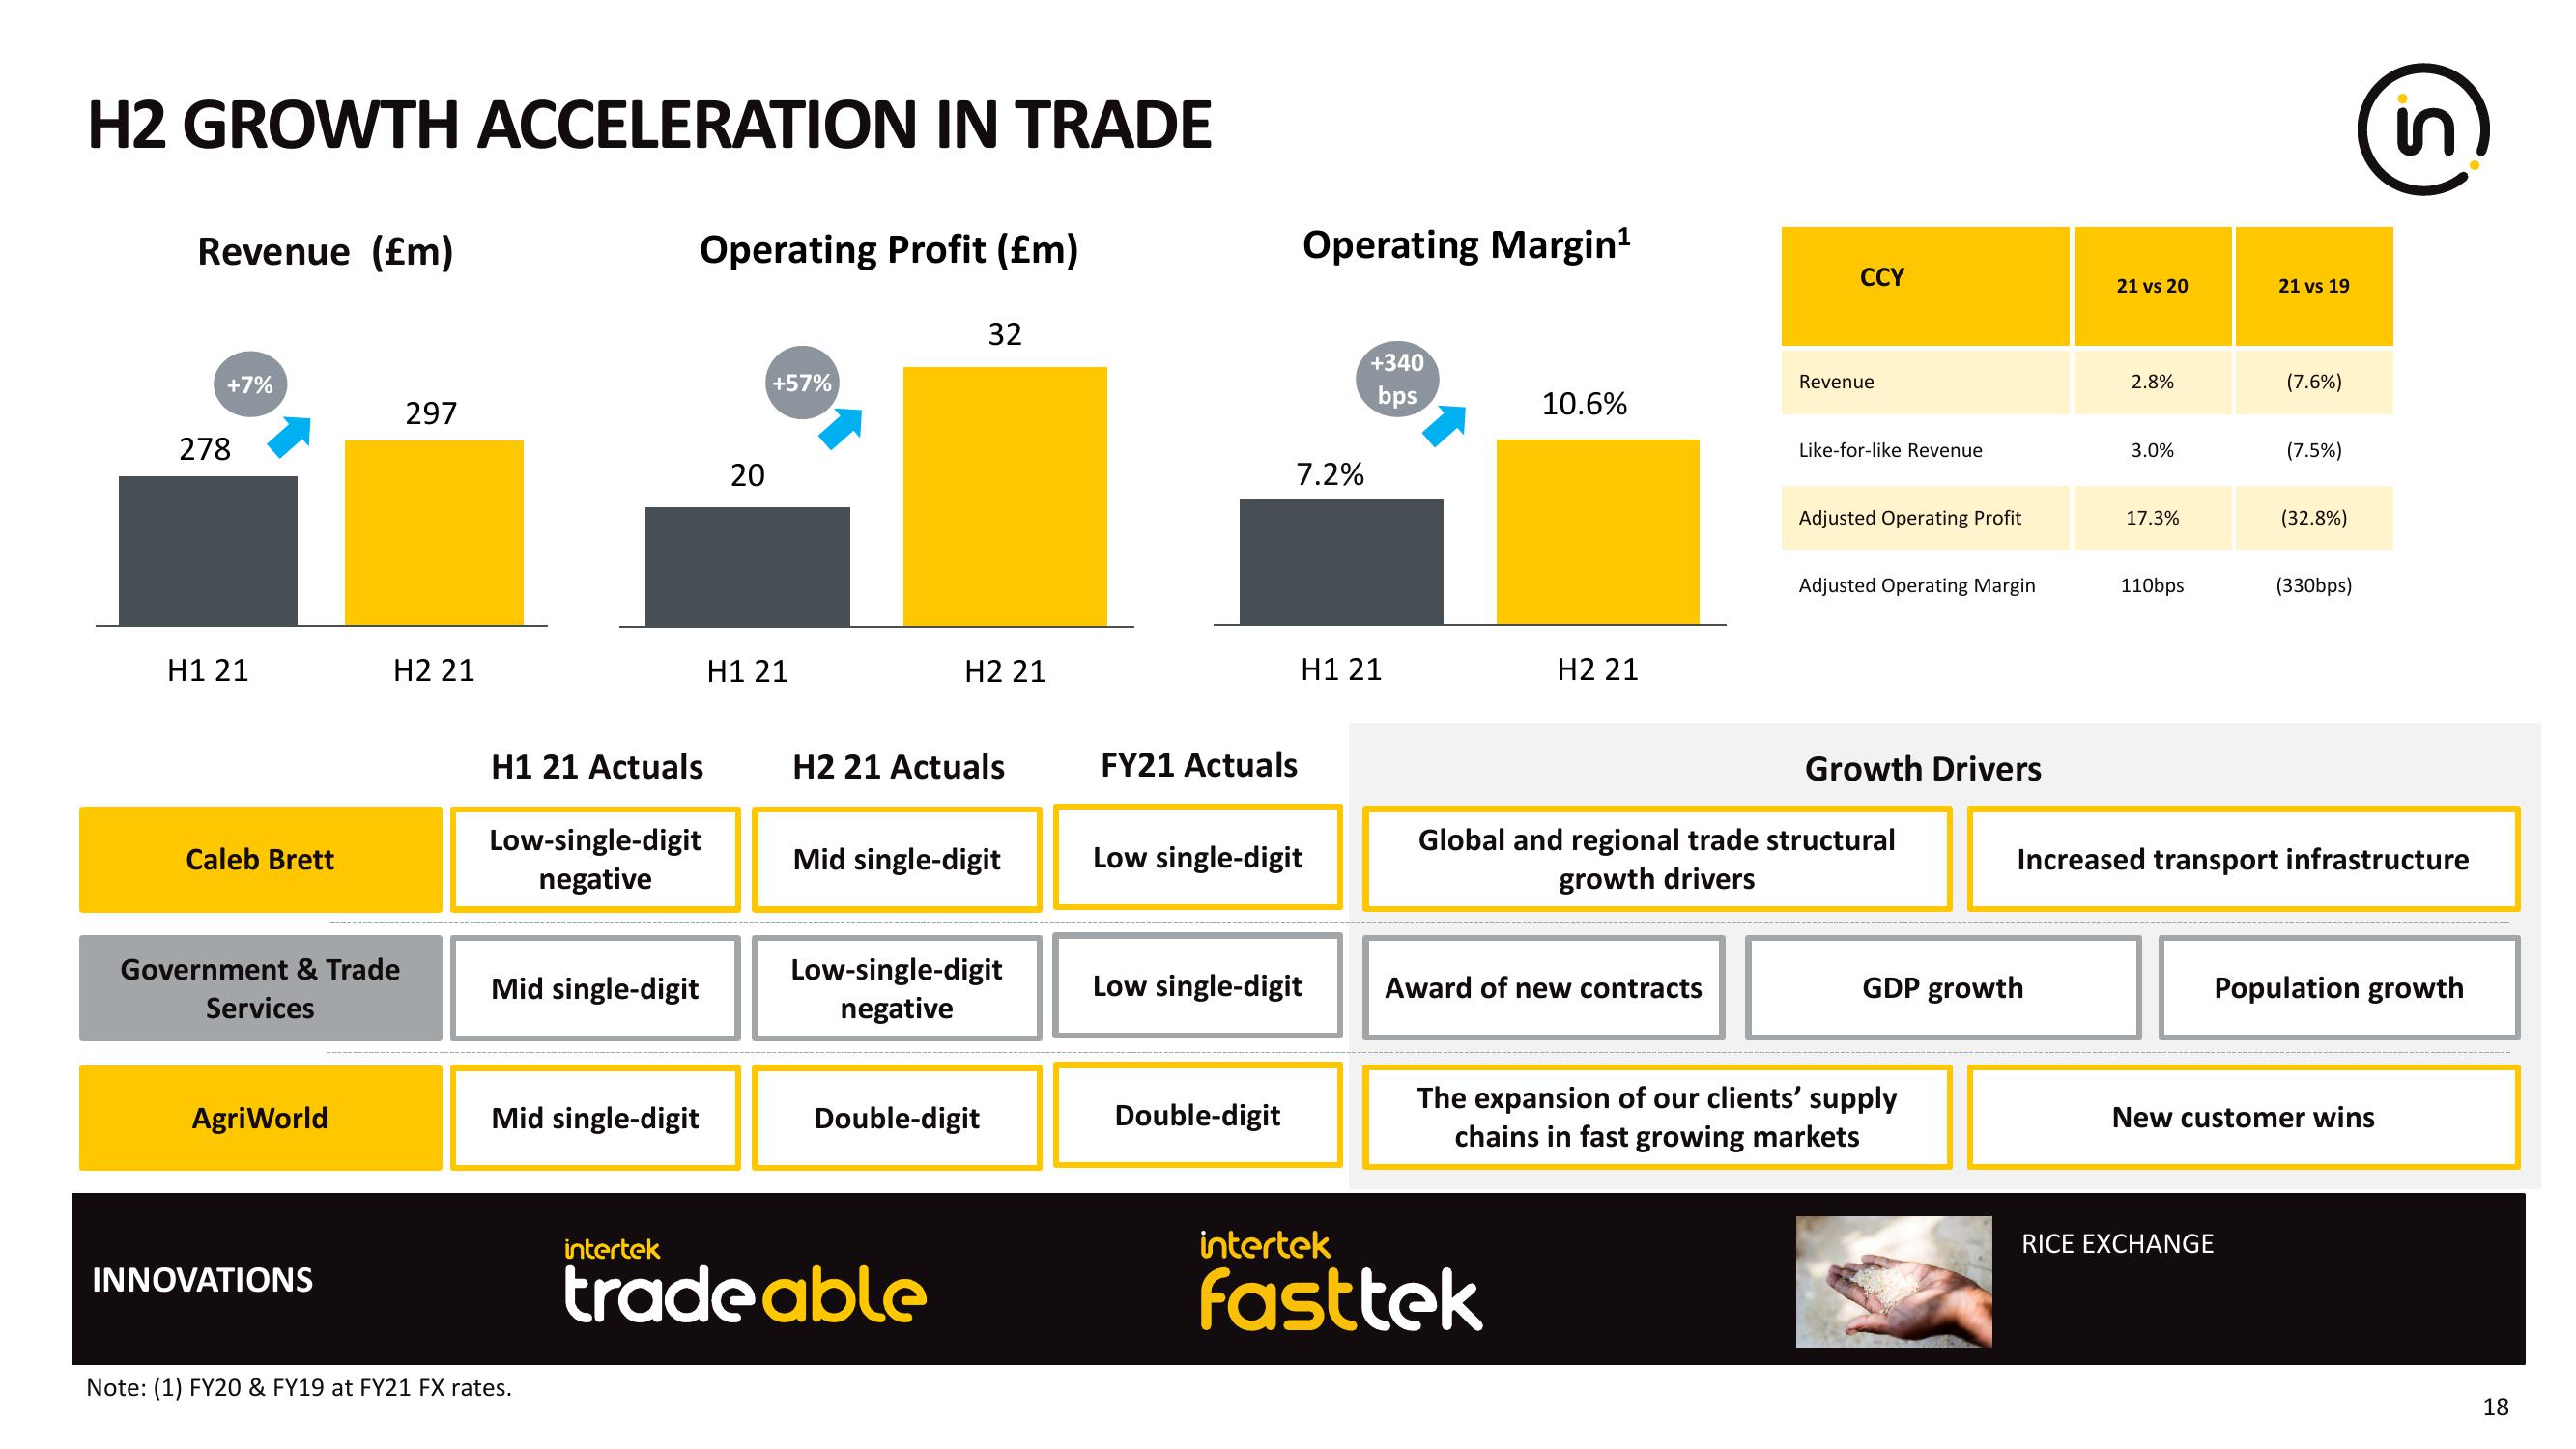
H2 GROWTH ACCELERATION IN TRADE
Revenue (£m)
+7%
278
H1 21
Caleb Brett
Government & Trade
Services
AgriWorld
INNOVATIONS
297
H2 21
H1 21 Actuals
Operating Profit (£m)
Low-single-digit
negative
Mid single-digit
Mid single-digit
Note: (1) FY20 & FY19 at FY21 FX rates.
intertek
20
+57%
H1 21
32
H2 21
H2 21 Actuals
Mid single-digit
Low-single-digit
negative
Double-digit
tradeable
FY21 Actuals
Operating Margin¹
7.2%
Double-digit
Low single-digit
H1 21
Low single-digit
+340
bps
10.6%
H2 21
Award of new contracts
intertek
fasttek
CCY
Revenue
Like-for-like Revenue
Adjusted Operating Profit
Adjusted Operating Margin
Global and regional trade structural
growth drivers
Growth Drivers
The expansion of our clients' supply
chains in fast growing markets
GDP growth
21 vs 20
2.8%
3.0%
17.3%
110bps
RICE EXC
21 vs 19
(7.6%)
(7.5%)
GE
(32.8%)
Increased transport infrastructure
(330bps)
in
Population growth
New customer wins
18View entire presentation