DraftKings Investor Day Presentation Deck
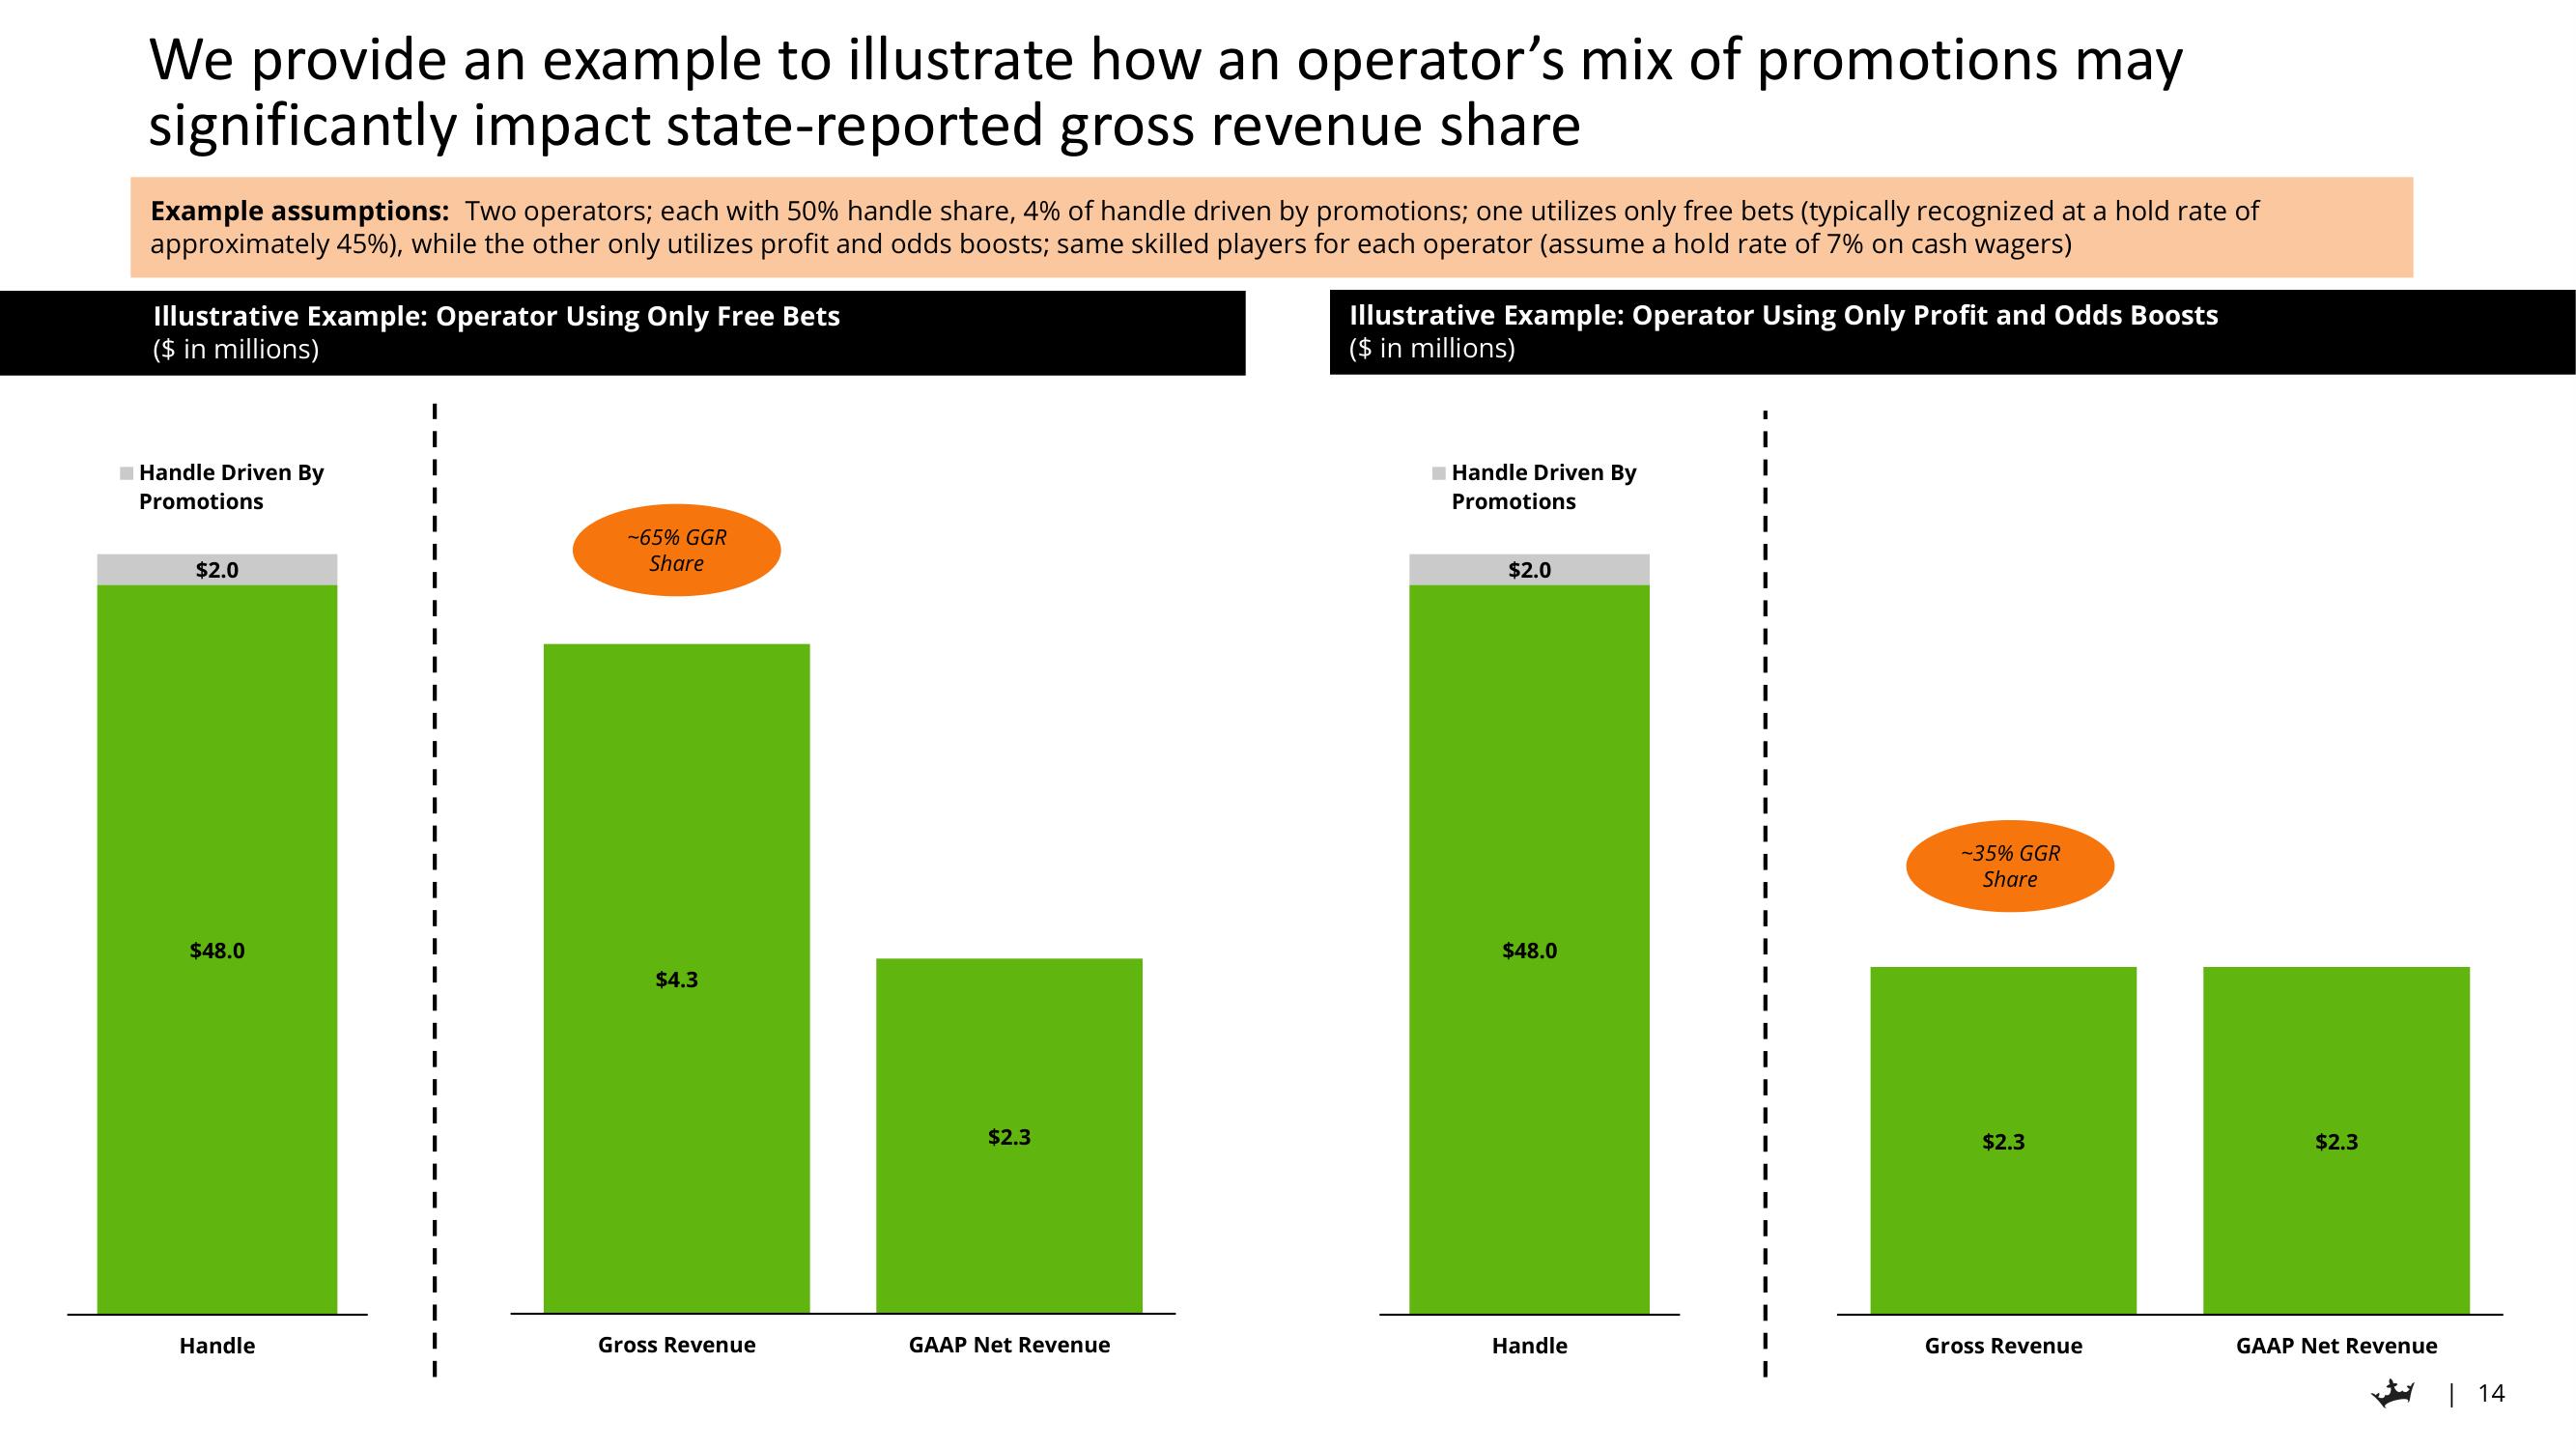
We provide an example to illustrate how an operator's mix of promotions may
significantly impact state-reported gross revenue share
Example assumptions: Two operators; each with 50% handle share, 4% of handle driven by promotions; one utilizes only free bets (typically recognized at a hold rate of
approximately 45%), while the other only utilizes profit and odds boosts; same skilled players for each operator (assume a hold rate of 7% on cash wagers)
Illustrative Example: Operator Using Only Free Bets
($ in millions)
Handle Driven By
Promotions
$2.0
-65% GGR
Share
II.1.
i.
$48.0
$4.3
$2.3
GAAP Net Revenue
$48.0
1
Handle
Illustrative Example: Operator Using Only Profit and Odds Boosts
($ in millions)
Gross Revenue
Handle Driven By
Promotions
$2.0
I
Handle
-35% GGR
Share
$2.3
Gross Revenue
$2.3
GAAP Net Revenue
| 14View entire presentation