Fiverr Investor Presentation Deck
GAAP to NON-GAAP Reconciliation
In $ thousands (Unaudited)
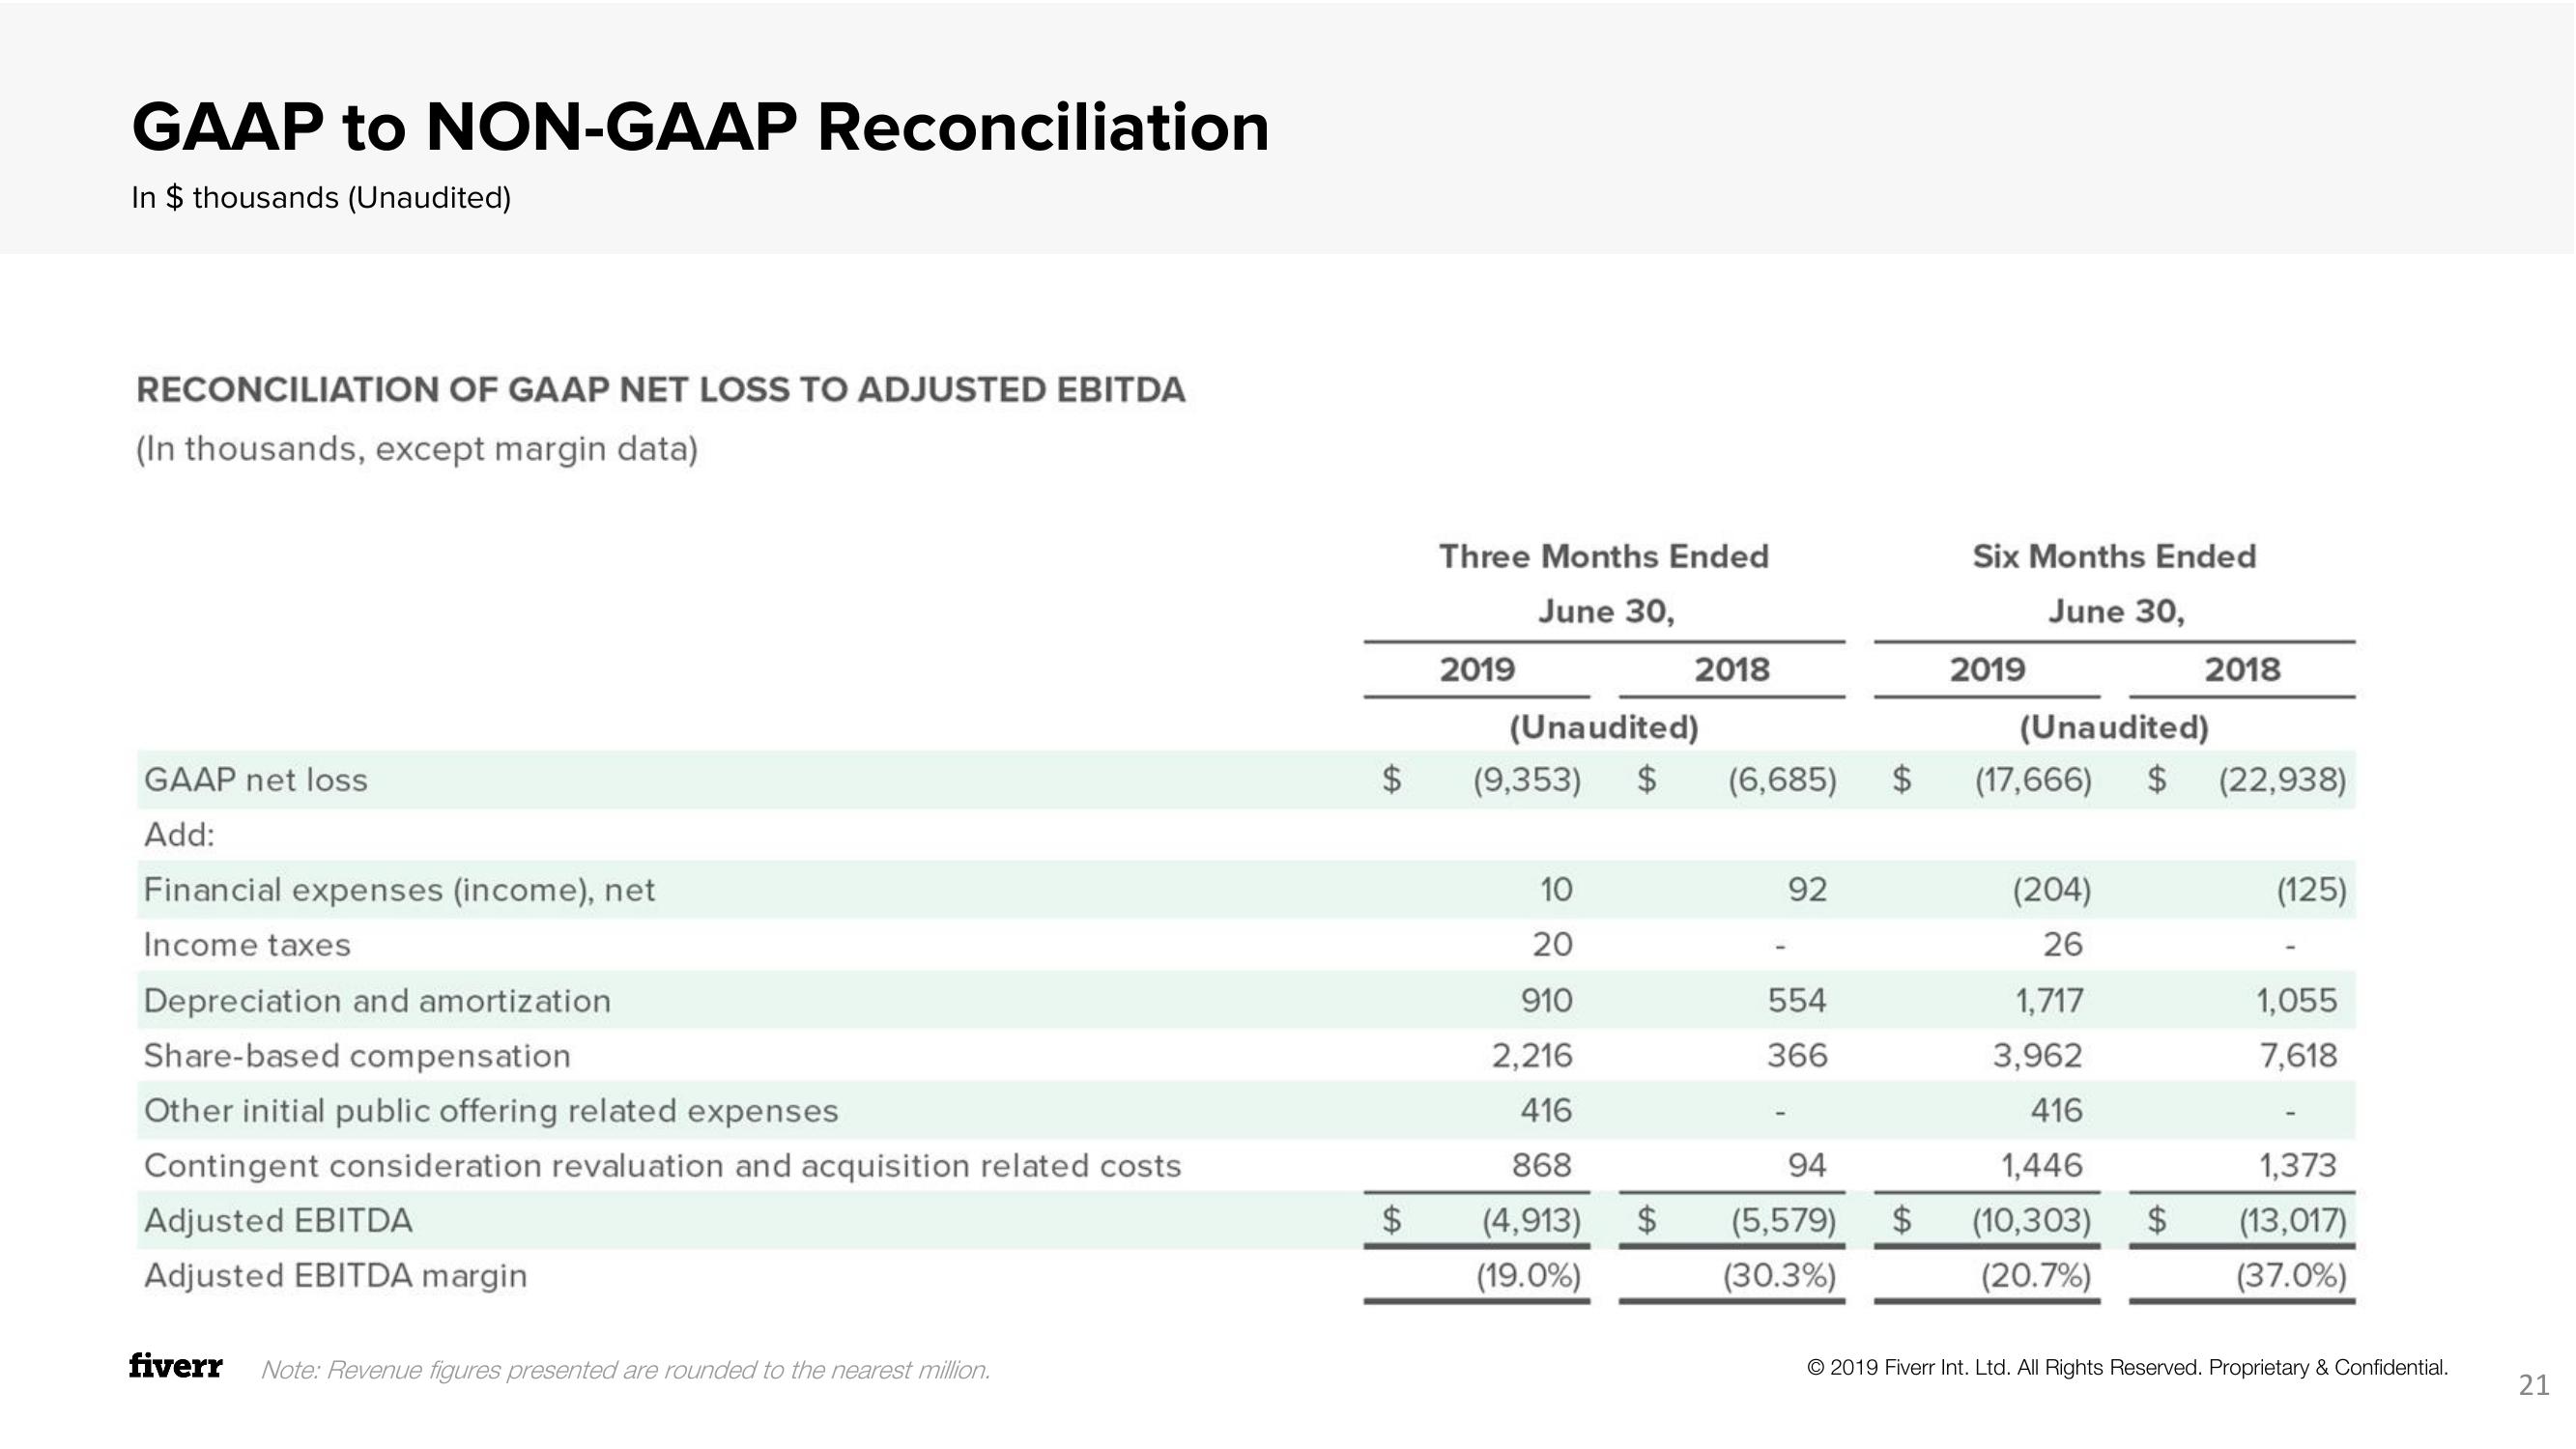
RECONCILIATION OF GAAP NET LOSS TO ADJUSTED EBITDA
(In thousands, except margin data)
GAAP net loss
Add:
Financial expenses (income), net
Income taxes
Depreciation and amortization
Share-based compensation
Other initial public offering related expenses
Contingent consideration revaluation and acquisition related costs
Adjusted EBITDA
Adjusted EBITDA margin
fiverr Note: Revenue figures presented are rounded to the nearest million.
$
$
Three Months Ended
June 30,
2019
(Unaudited)
(9,353) $
10
20
910
2,216
416
868
(4,913)
(19.0%)
2018
$
(6,685)
92
554
366
94
(5,579) $
(30.3%)
Six Months Ended
June 30,
2019
(Unaudited)
(17,666) $ (22,938)
(204)
26
2018
1,717
3,962
416
1,446
(10,303) $
(20.7%)
(125)
1,055
7,618
1,373
(13,017)
(37.0%)
© 2019 Fiverr Int. Ltd. All Rights Reserved. Proprietary & Confidential.
21View entire presentation