LSE Results Presentation Deck
Strong cash generation
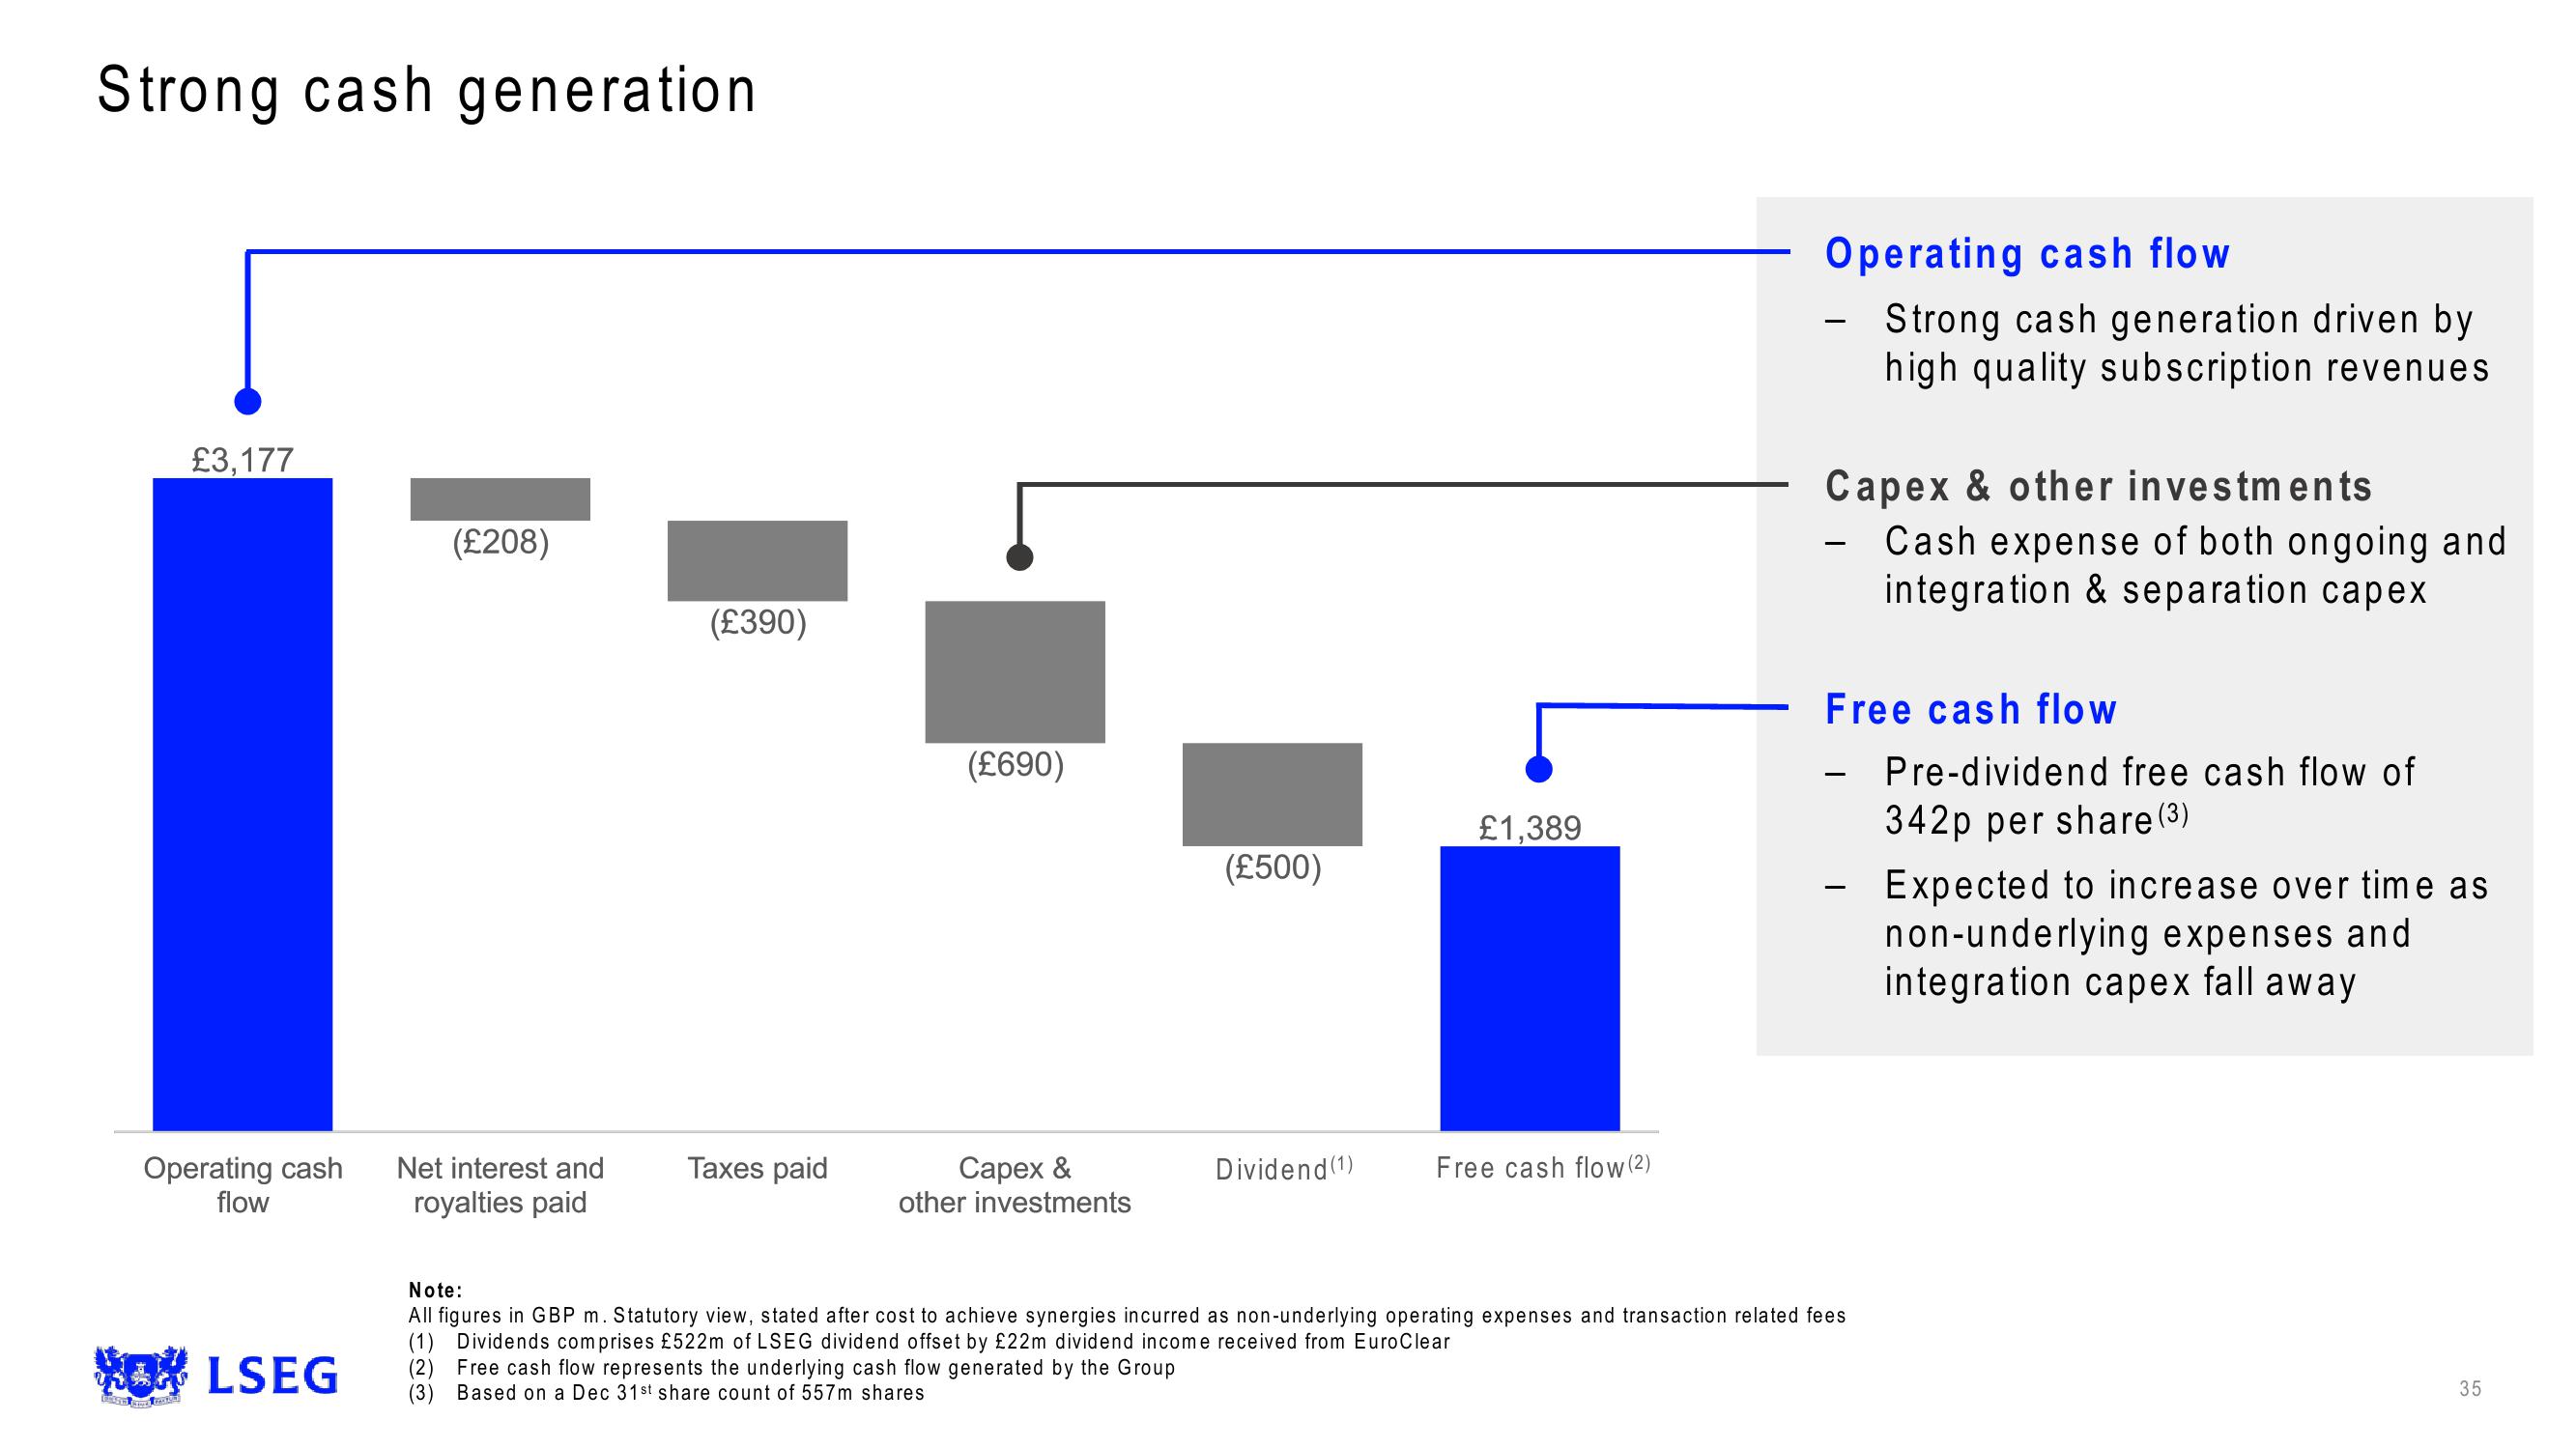
£3,177
Operating cash
flow
WOLSEG
(£208)
Net interest and
royalties paid
(£390)
Taxes paid
(£690)
Capex &
other investments
(£500)
(2) Free cash flow represents the underlying cash flow generated by the Group
(3) Based on a Dec 31st share count of 557m shares
Dividend (1)
£1,389
Free cash flow (2)
Operating cash flow
Strong cash generation driven by
high quality subscription revenues
Capex & other investments
- Cash expense of both ongoing and
integration & separation capex
Free cash flow
-
Note:
All figures in GBP m. Statutory view, stated after cost to achieve synergies incurred as non-underlying operating expenses and transaction related fees
(1) Dividends comprises £522m of LSEG dividend offset by £22m dividend income received from EuroClear
Pre-dividend free cash flow of
342p per share (3)
Expected to increase over time as
non-underlying expenses and
integration capex fall away
35View entire presentation