MSR Value Growth & Market Trends
6 |
SUMMARY 3Q'21 FINANCIAL RESULTS
$ mm's, except per share data
Servicing
Originations
Corporate debt interest expense
Corporate expense/other
Pretax operating income from continuing
operations (1)
Other mark-to-market
Loss on redemption of unsecured senior notes
Gain from Title365 sale
Discontinued operations
Adjustments
Intangible amortization
Pretax income
Income tax expense
Net income
Weighted average diluted sharecount
Diluted EPS (2)
GAAP ROTCE
Operating ROTCE (1) (3)
3Q'21
$44
273
(30)
(24)
$263
153
(15)
1
(3)
$399
(100)
$299
82.1
$3.29
37.8%
25.2%
(1) Please see appendix for reconciliations of non-GAAP items
(2) Per share data calculated based on net income (loss) attributable to common shareholders
(3) Assumes GAAP tax-rate of 24.2% and does not give credit to cash flow benefits of the DTA
2Q¹21
$80
213
(30)
(36)
$227
(135)
485
16
(7)
(3)
$583
(144)
$439
89.6
$4.85
58.9%
23.1%
3Q'20
($62)
438
(44)
(19)
$313
(4)
(53)
35
(1)
(9)
$281
(67)
$214
95.0
$2.18
41.2%
45.7%
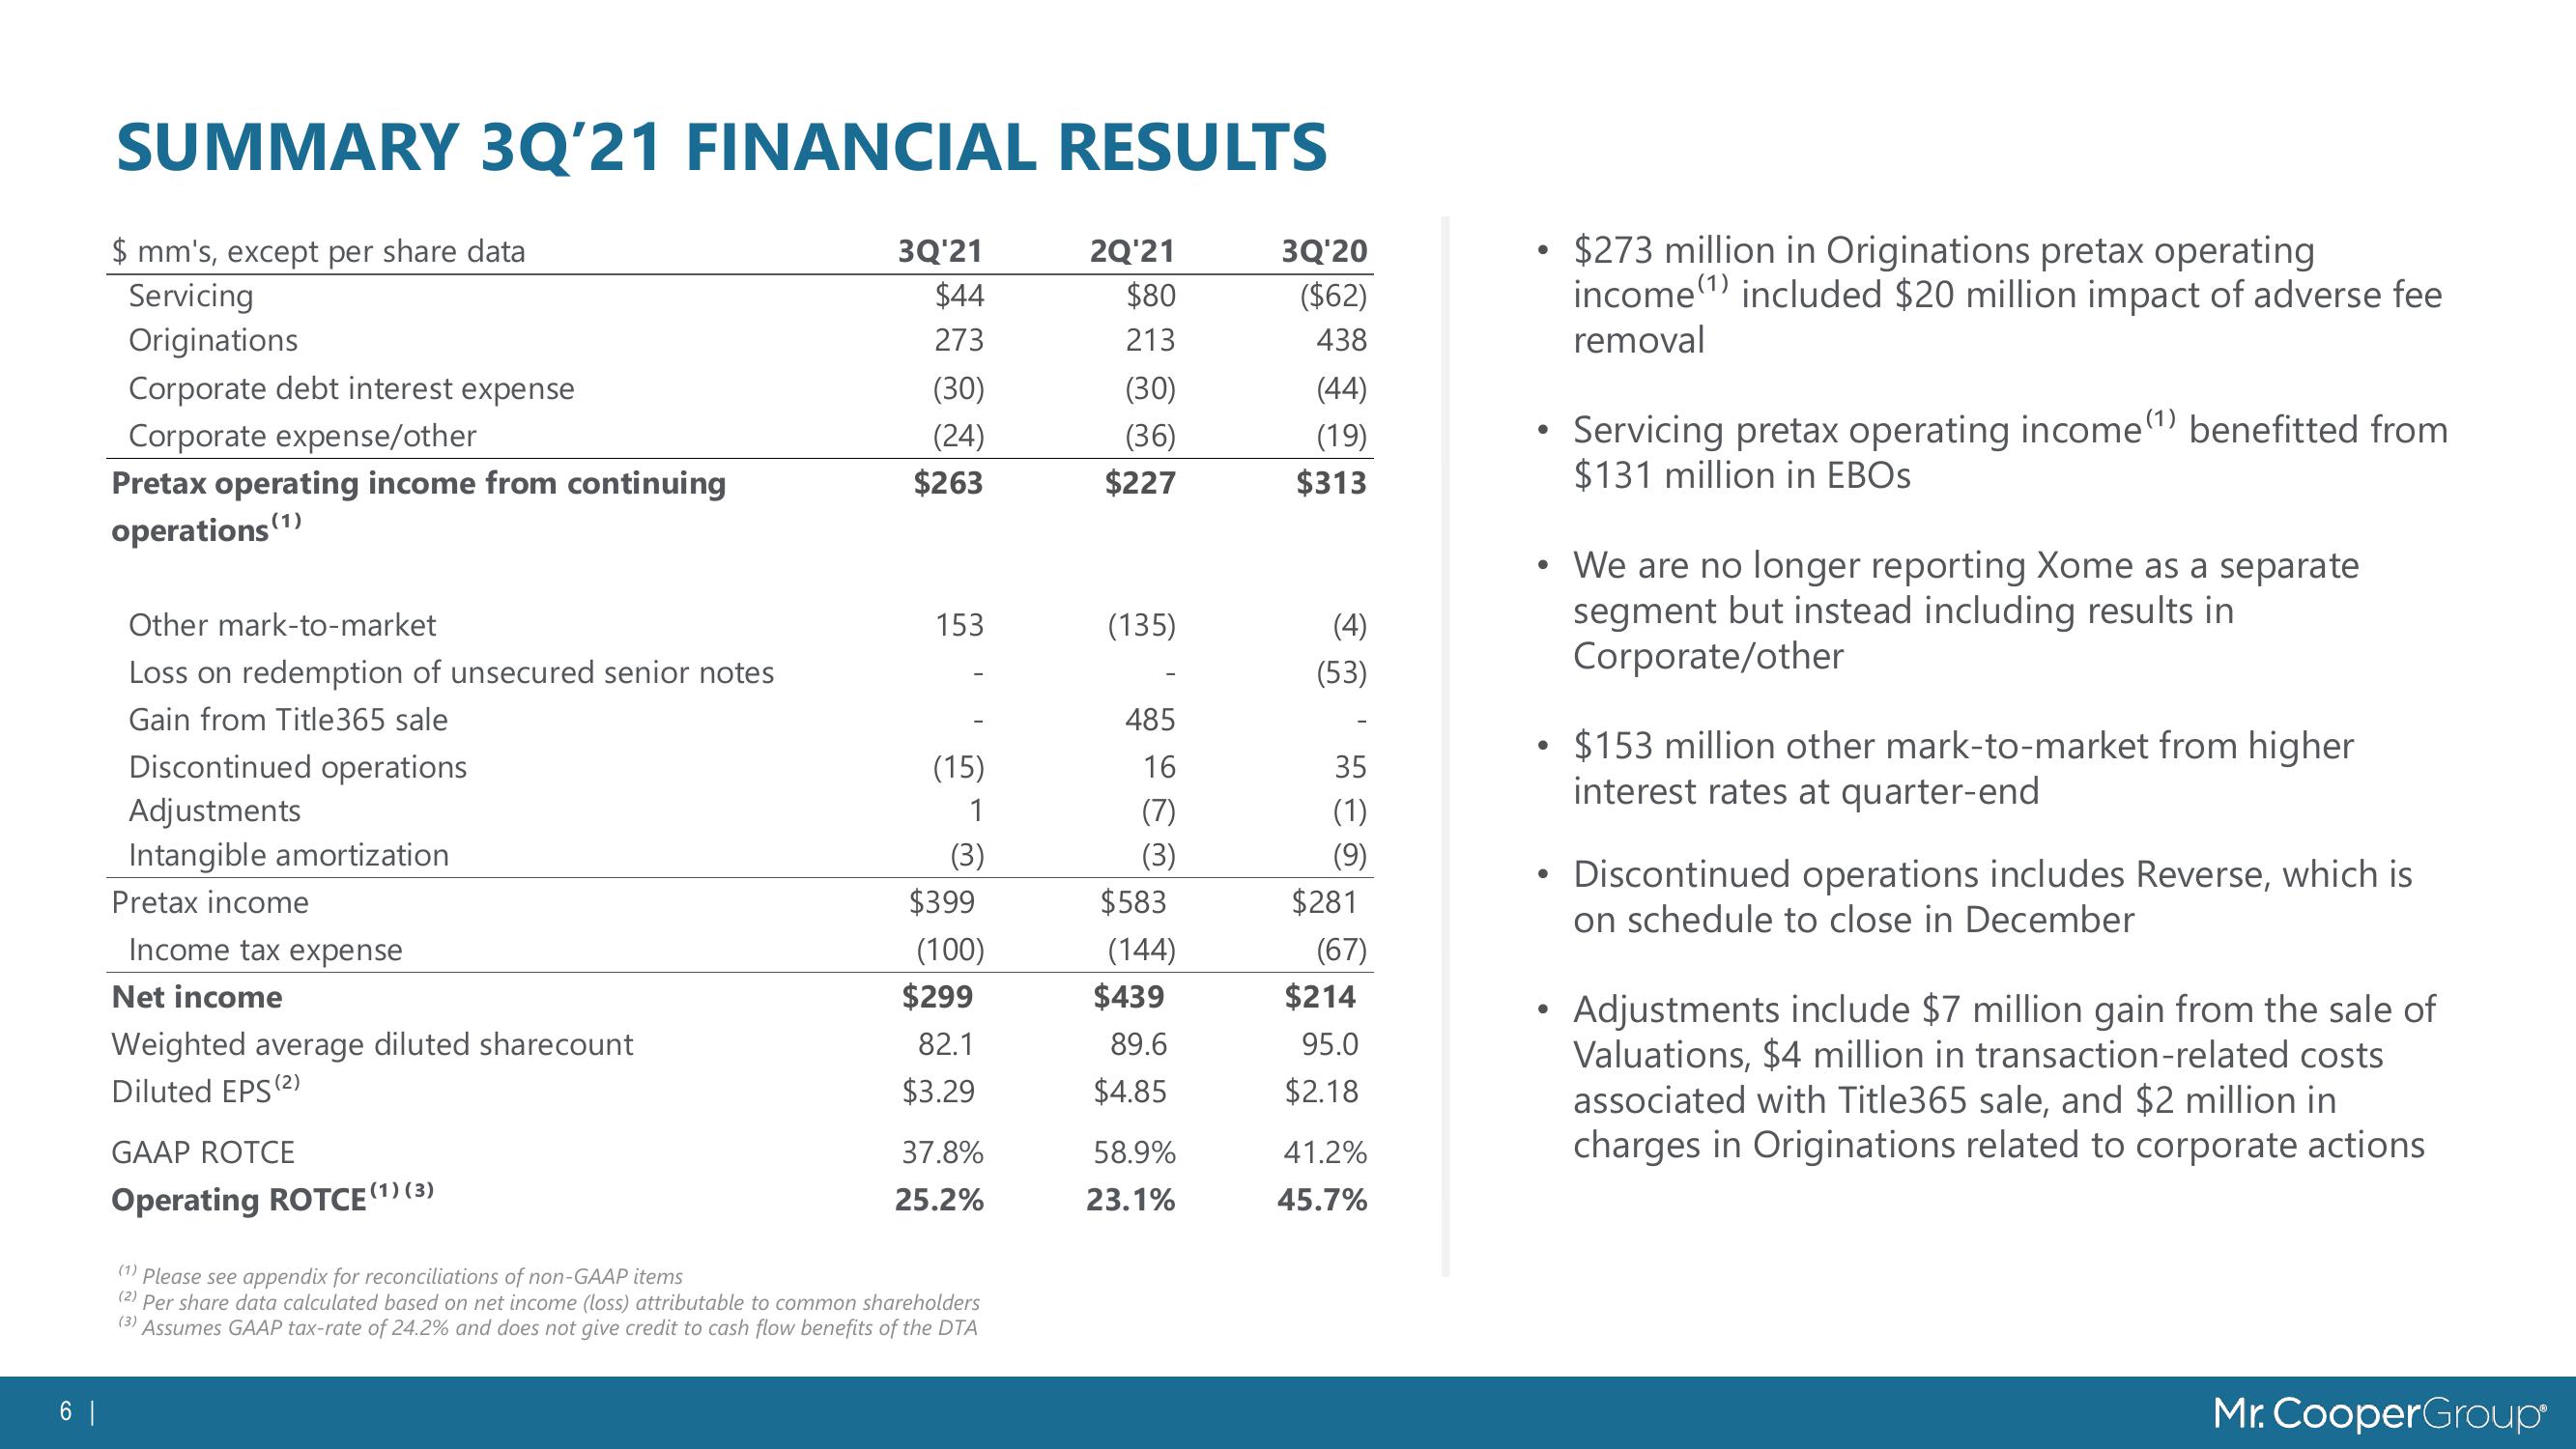
$273 million in Originations pretax operating
income (1) included $20 million impact of adverse fee
removal
Servicing pretax operating income (1) benefitted from
$131 million in EBOS
• We are no longer reporting Xome as a separate
segment but instead including results in
Corporate/other
●
• $153 million other mark-to-market from higher
interest rates at quarter-end
●
• Discontinued operations includes Reverse, which is
on schedule to close in December
Adjustments include $7 million gain from the sale of
Valuations, $4 million in transaction-related costs
associated with Title365 sale, and $2 million in
charges in Originations related to corporate actions
Mr. CooperGroupView entire presentation