Advent Capital Balanced Strategy Update
BALANCED STRATEGY
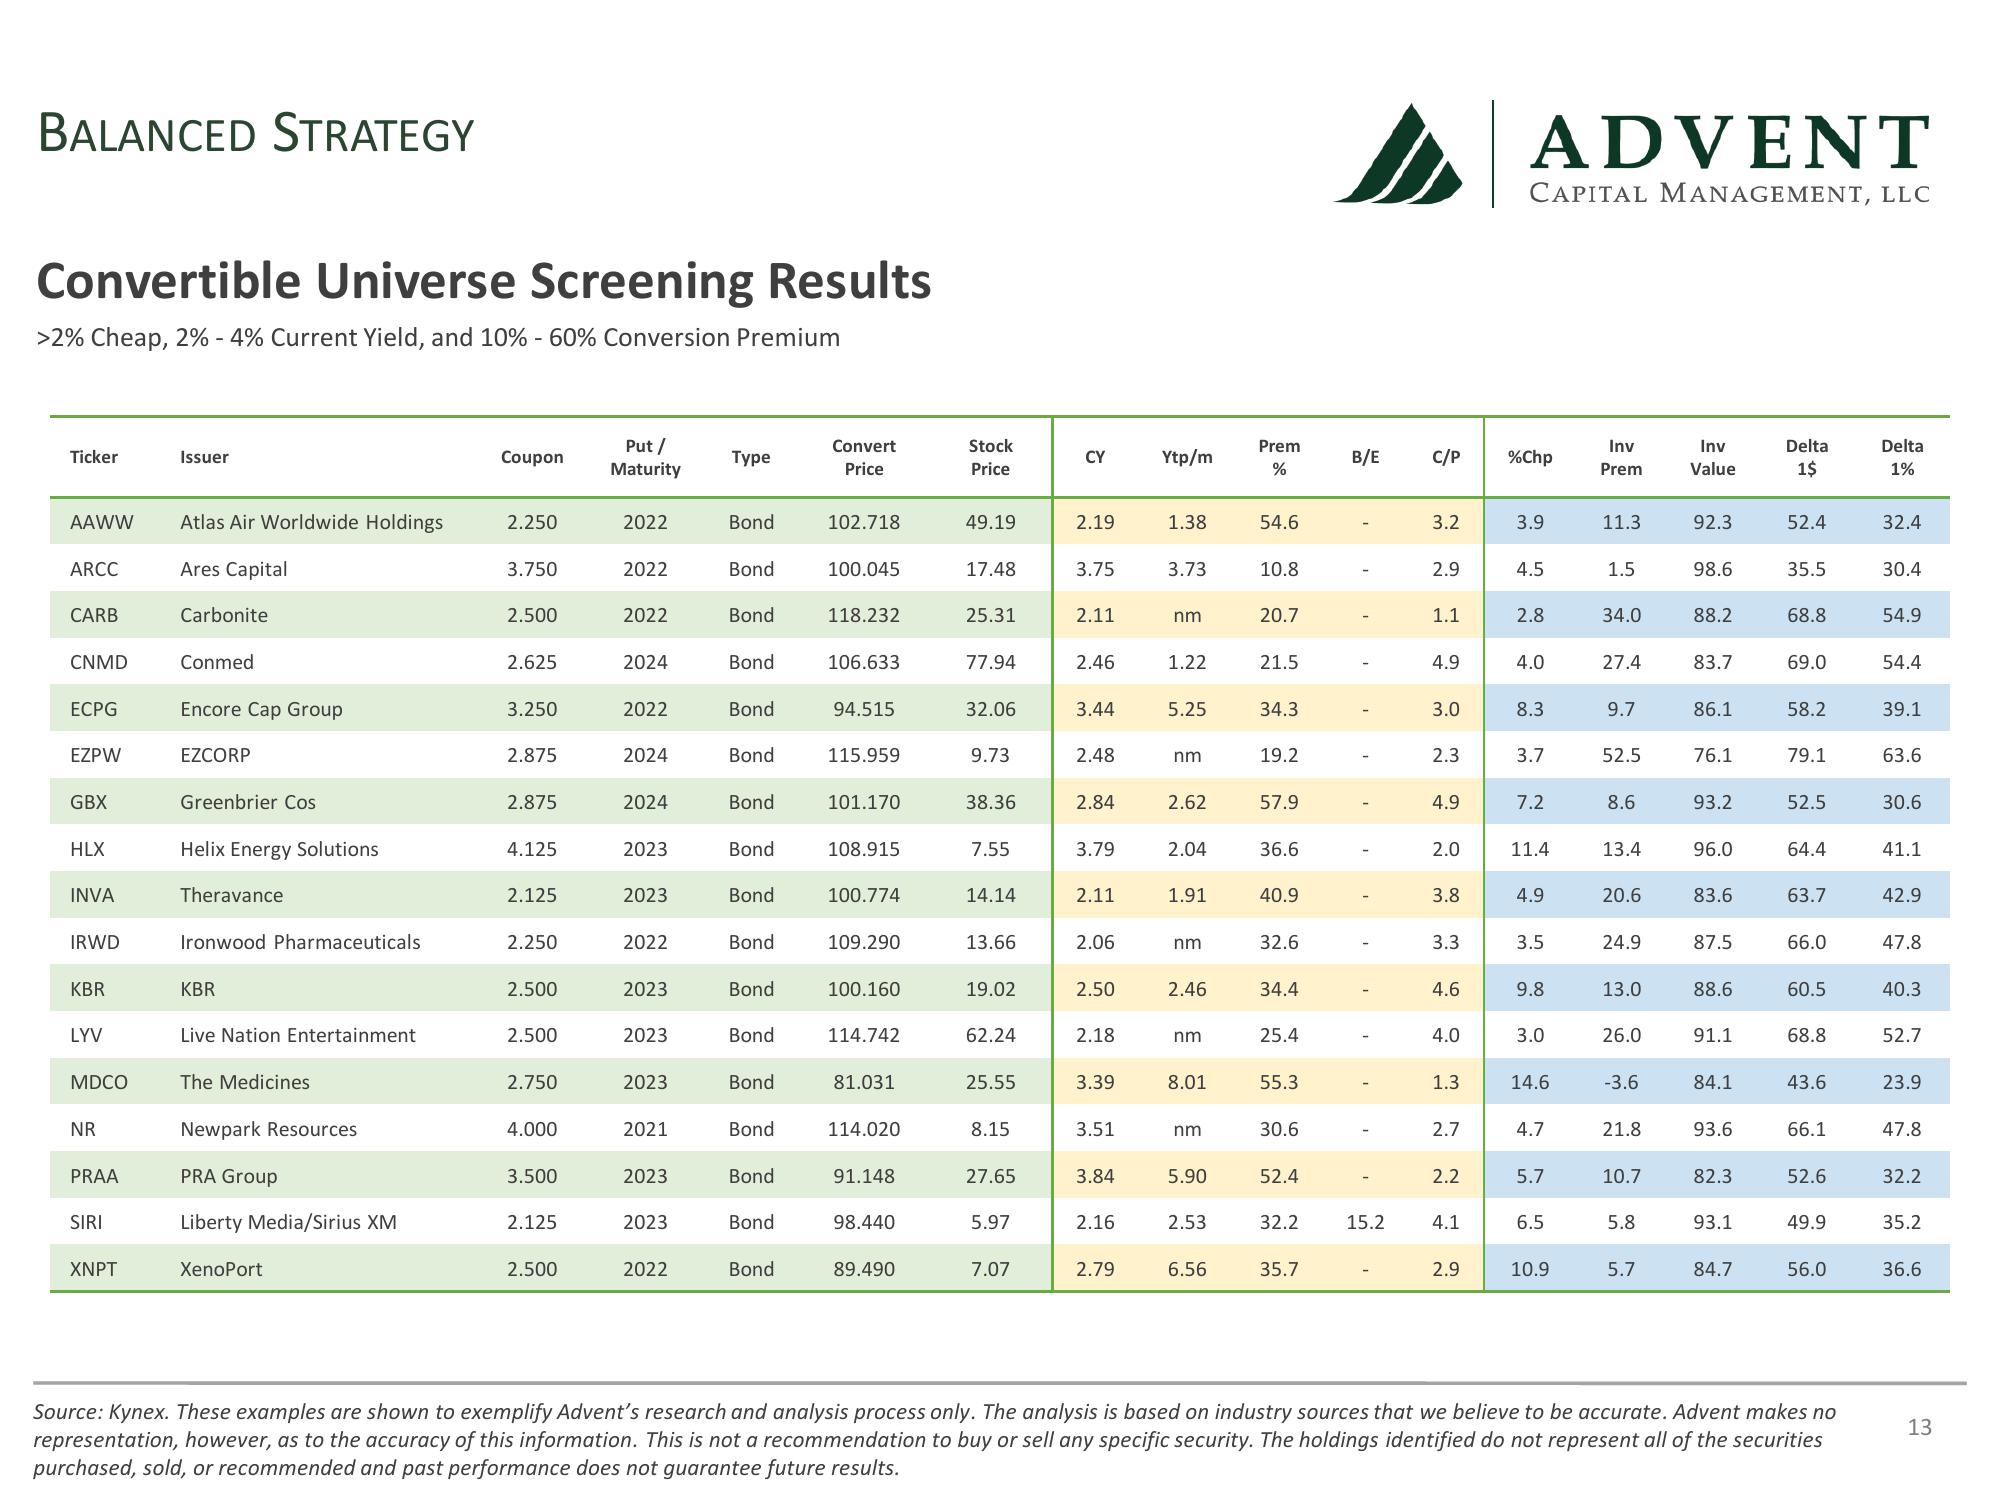
Convertible Universe Screening Results
>2% Cheap, 2% -4% Current Yield, and 10% - 60% Conversion Premium
Ticker
AAWW
ARCC
CARB
CNMD
ECPG
EZPW
GBX
HLX
INVA
IRWD
KBR
LYV
MDCO
NR
PRAA
SIRI
XNPT
Issuer
Atlas Air Worldwide Holdings
Ares Capital
Carbonite
Conmed
Encore Cap Group
EZCORP
Greenbrier Cos
Helix Energy Solutions.
Theravance
Ironwood Pharmaceuticals
KBR
Live Nation Entertainment
The Medicines
Newpark Resources
PRA Group
Liberty Media/Sirius XM
XenoPort
Coupon
2.250
3.750
2.500
2.625
3.250
2.875
2.875
4.125
2.125
2.250
2.500
2.500
2.750
4.000
3.500
2.125
2.500
Put /
Maturity
2022
2022
2022
2024
2022
2024
2024
2023
2023
2022
2023
2023
2023
2021
2023
2023
2022
Type
Bond
Bond
Bond
Bond
Bond
Bond
Bond
Bond
Bond
Bond
Bond
Bond
Bond
Bond
Bond
Bond
Bond
Convert
Price
102.718
100.045
118.232
106.633
94.515
115.959
101.170
108.915
100.774
109.290
100.160
114.742
81.031
114.020
91.148
98.440
89.490
Stock
Price
49.19
17.48
25.31
77.94
32.06
9.73
38.36
7.55
14.14
13.66
19.02
62.24
25.55
8.15
27.65
5.97
7.07
CY
2.19
3.75
2.11
2.46
3.44
2.48
2.84
3.79
2.11
2.06
2.50
2.18
3.39
3.51
3.84
2.16
2.79
Ytp/m
1.38
3.73
nm
1.22
5.25
nm
2.62
2.04
1.91
nm
2.46
nm
8.01
nm
5.90
2.53
6.56
Prem
%
54.6
10.8
20.7
21.5
34.3
19.2
57.9
36.6
40.9
32.6
34.4
25.4
55.3
30.6
52.4
32.2
35.7
B/E
1
1
15.2
C/P
3.2
2.9
1.1
4.9
3.0
2.3
4.9
2.0
3.8
3.3
4.6
4.0
1.3.
2.7
2.2
4.1
2.9
ADVENT
CAPITAL MANAGEMENT, LLC
%Chp
3.9
4.5
2.8
4.0
8.3
3.7
7.2
11.4
4.9
3.5
9.8
3.0
14.6
4.7
5.7
6.5
10.9
Inv
Prem
11.3
1.5
34.0
27.4
9.7
52.5
8.6
13.4
20.6
24.9
13.0
26.0
-3.6
21.8
10.7
5.8
5.7
Inv
Value
92.3
98.6
88.2
83.7
86.1
76.1
93.2
96.0
83.6
87.5
88.6
91.1
84.1
93.6
82.3
93.1
84.7
Delta
1$
52.4
35.5
68.8
69.0
58.2
79.1
52.5
64.4
63.7
66.0
60.5
68.8
43.6
66.1
52.6
49.9
56.0
Source: Kynex. These examples are shown to exemplify Advent's research and analysis process only. The analysis is based on industry sources that we believe to be accurate. Advent makes no
representation, however, as to the accuracy of this information. This is not a recommendation to buy or sell any specific security. The holdings identified do not represent all of the securities
purchased, sold, or recommended and past performance does not guarantee future results.
Delta
1%
32.4
30.4
54.9
54.4
39.1
63.6
30.6
41.1
42.9
47.8
40.3
52.7
23.9
47.8
32.2
35.2
36.6
13View entire presentation